An alternative income idea for a higher interest rate world


Under the old playbook, a 5% US Treasury yield should have pushed emerging market debt to the back of the queue. Instead, local and hard-currency EM bonds, along with Chinese government bonds, have outperformed developed market bonds and US Treasuries this year.
But this is more than a quirk of performance.
While developed markets have continued to accumulate debt, many emerging economies have reduced foreign currency borrowing, deepened domestic bond markets and strengthened monetary institutions. Those reforms help explain why EM debt has held up through this rate cycle and may be a more attractive opportunity today than it has been in generations.
Why emerging market debt deserves another look
Higher energy prices, concerns over the stubbornness of inflation, soaring government borrowing and tighter monetary policy have pushed yields higher across several developed markets, including the US and Australia.
Meanwhile, EM debt has not responded as one undifferentiated risk asset. As the below chart shows, EM bonds outperformed their developed-market counterparts and US Treasuries over the year to 15 September.
Chart 1: EM bonds and China bonds outperform DM bonds and Treasuries (YTD to 15 September 2026)
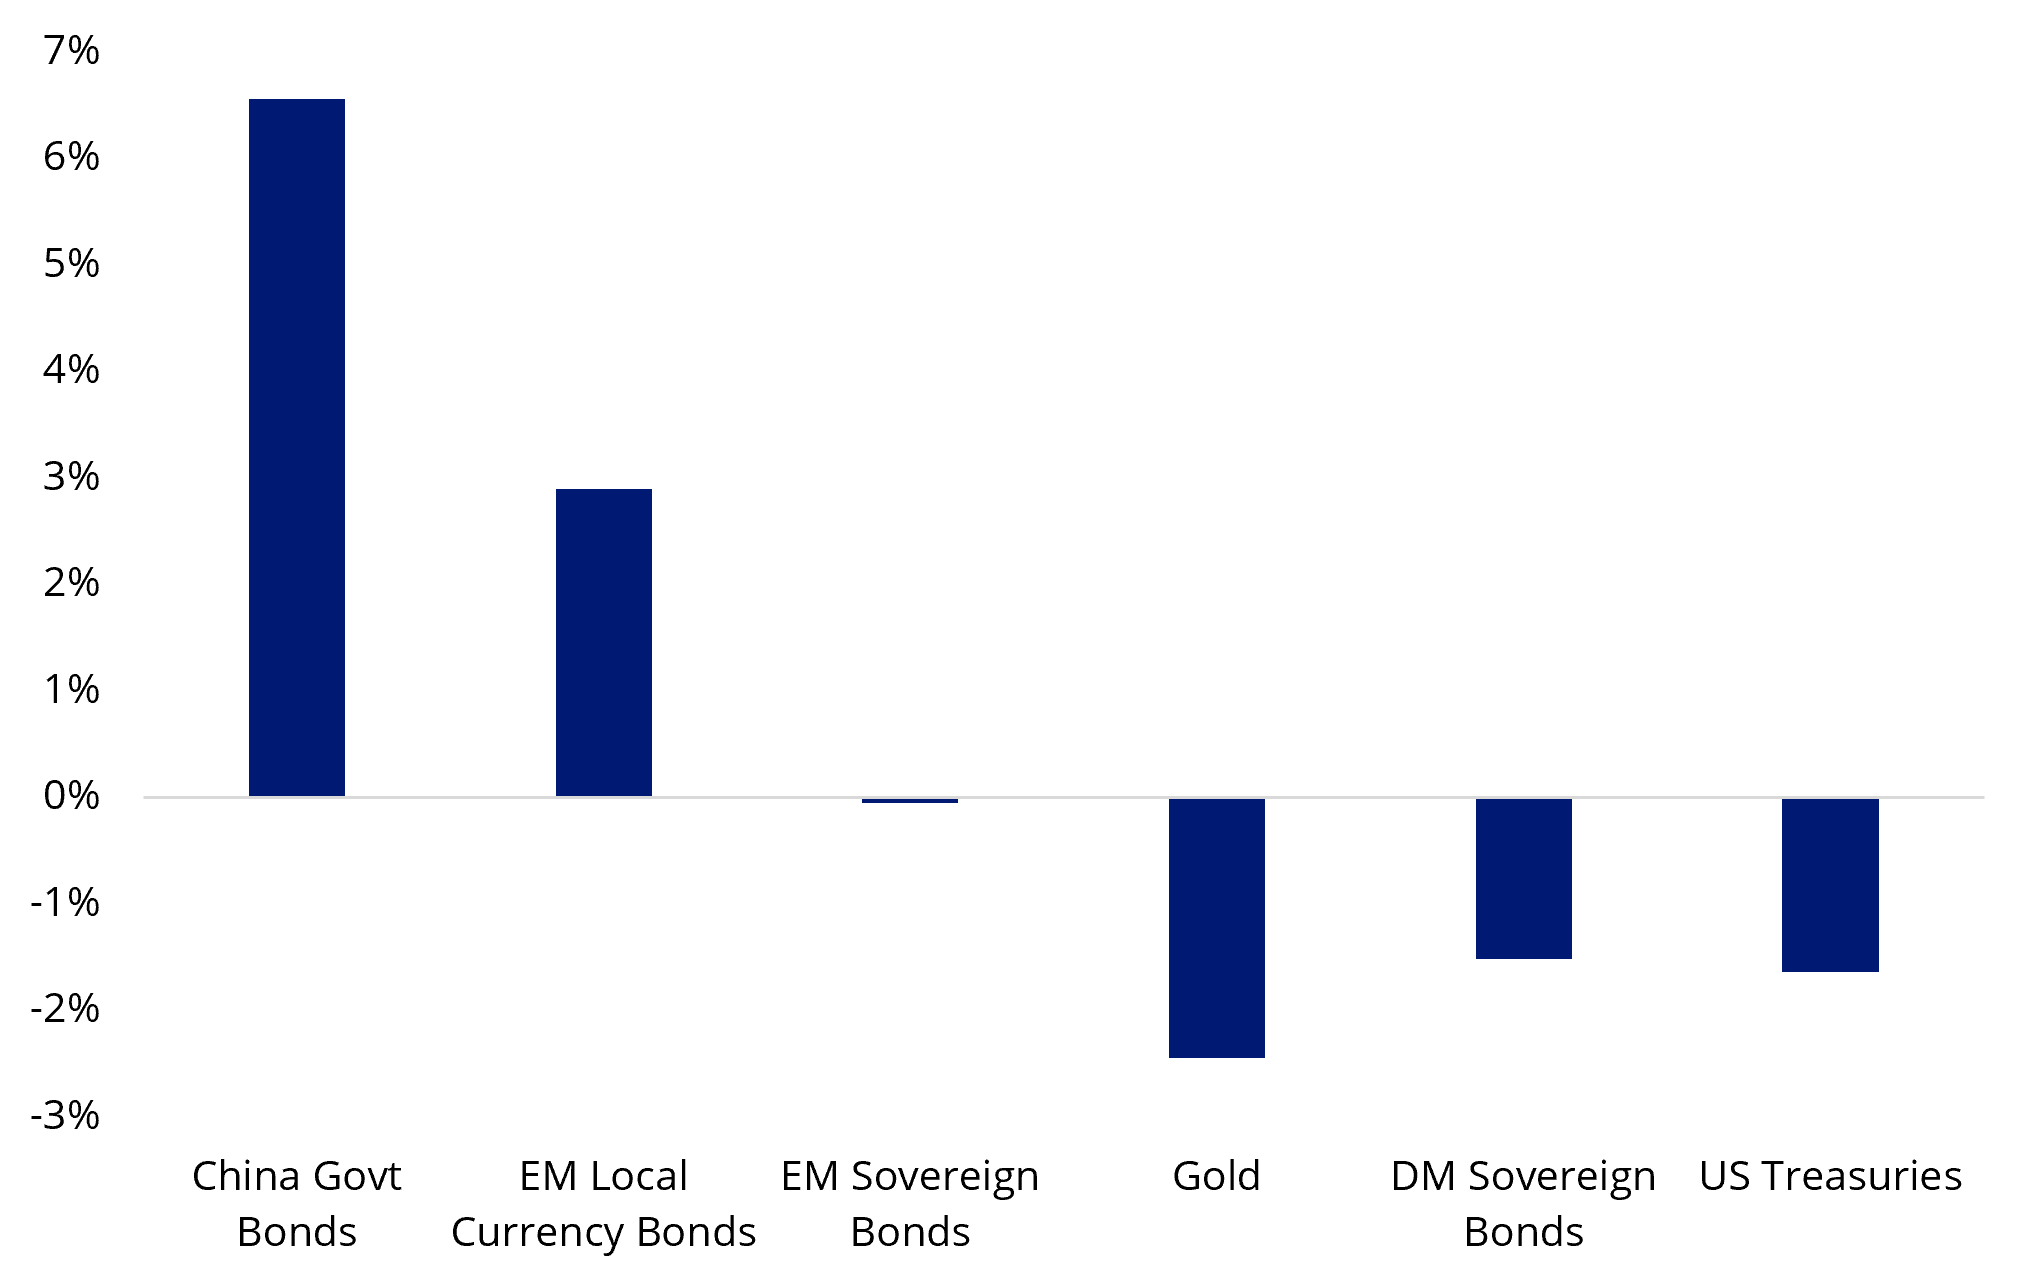
Source: VanEck. YTD total returns (%) to 15 September 2026 in USD. Proxies: China Government Bonds - iShares China CNY Govt Bond UCITS ETF (CGBI NA Equity); EM Local Currency Bonds - iShares EM Local Currency Bond ETF (LEMB US Equity); EM Sovereign Bonds (USD) - iShares USD EM Bond ETF (EMB US Equity); Gold - XAUUSD Spot, USD price return (XAUUSD Curncy);DM Sovereign Bonds - FTSE World Government Bond Index (SBWGU Index); US Treasuries - Bloomberg US Treasury Total Return Index (LUATTRUU Index). Where a proxy is an ETF, the performance is net of management fees. Past performance is not indicative of future performance.
The case for EM debt has been building for some time, but investor allocations continue to remain subdued. For many investors, EM debt is still viewed through the lens of past crises in Asia, Russia and Argentina. Those episodes fixed fiscal instability, currency collapse and sudden capital flight in the market’s memory, even though the foundations of many emerging economies have since changed.
That gap between perception and reality matters. A high headline yield is only attractive if the issuer can service its debt, preserve the value of its currency and maintain investor confidence. On several of those measures, the contrast between emerging and developed economies is becoming narrower than many investors may realise.
How EM debt has performed during previous Fed hiking cycles
The next two charts show that EM debt delivered positive cumulative returns during the 2004–06 and 2015–19 US Federal Reserve hiking cycles. Local-currency bonds led during the first period, while both local- and hard-currency debt finished the second ahead of US Treasuries despite sharp swings.
Charts 2 and 3: Emerging markets debt performance during past US Fed rate hikes
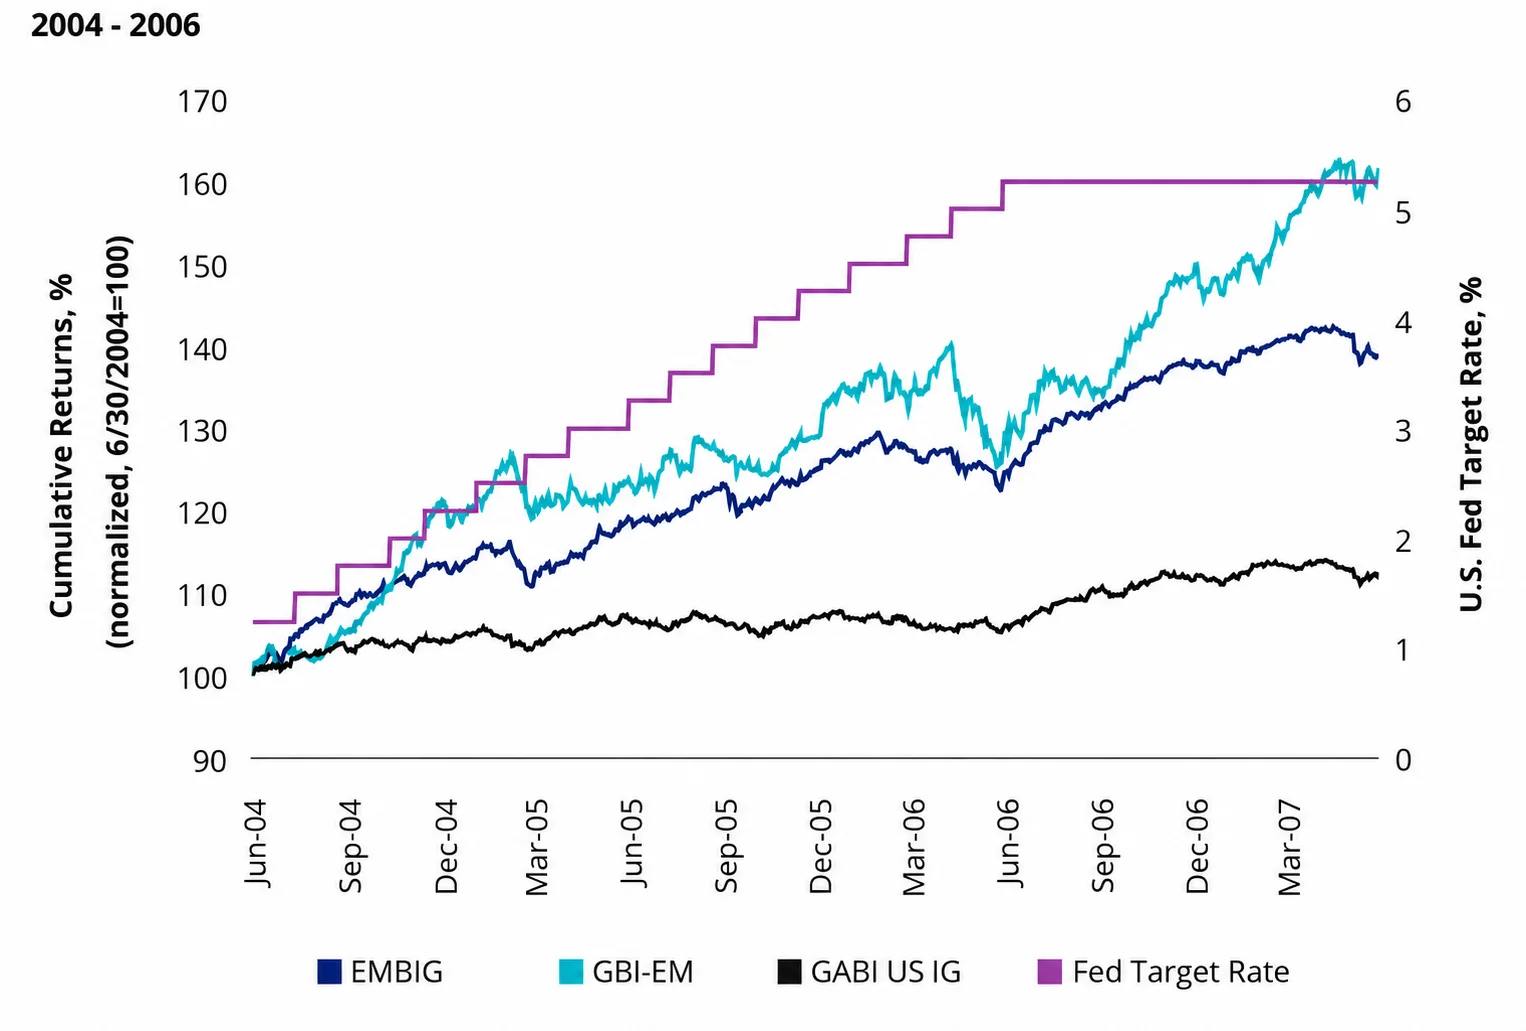
Source: IMF. EMBIG is the J.P. Morgan Emerging Markets Bond Index Global Index. GBI-EM is the J.P. Morgan Government Bond Index-Emerging Markets Index. GABI US IG is the J.P. Morgan Global Aggregate Bond Index US Investment Grade. You cannot invest in an index. Past performance is not indictive of future performance.
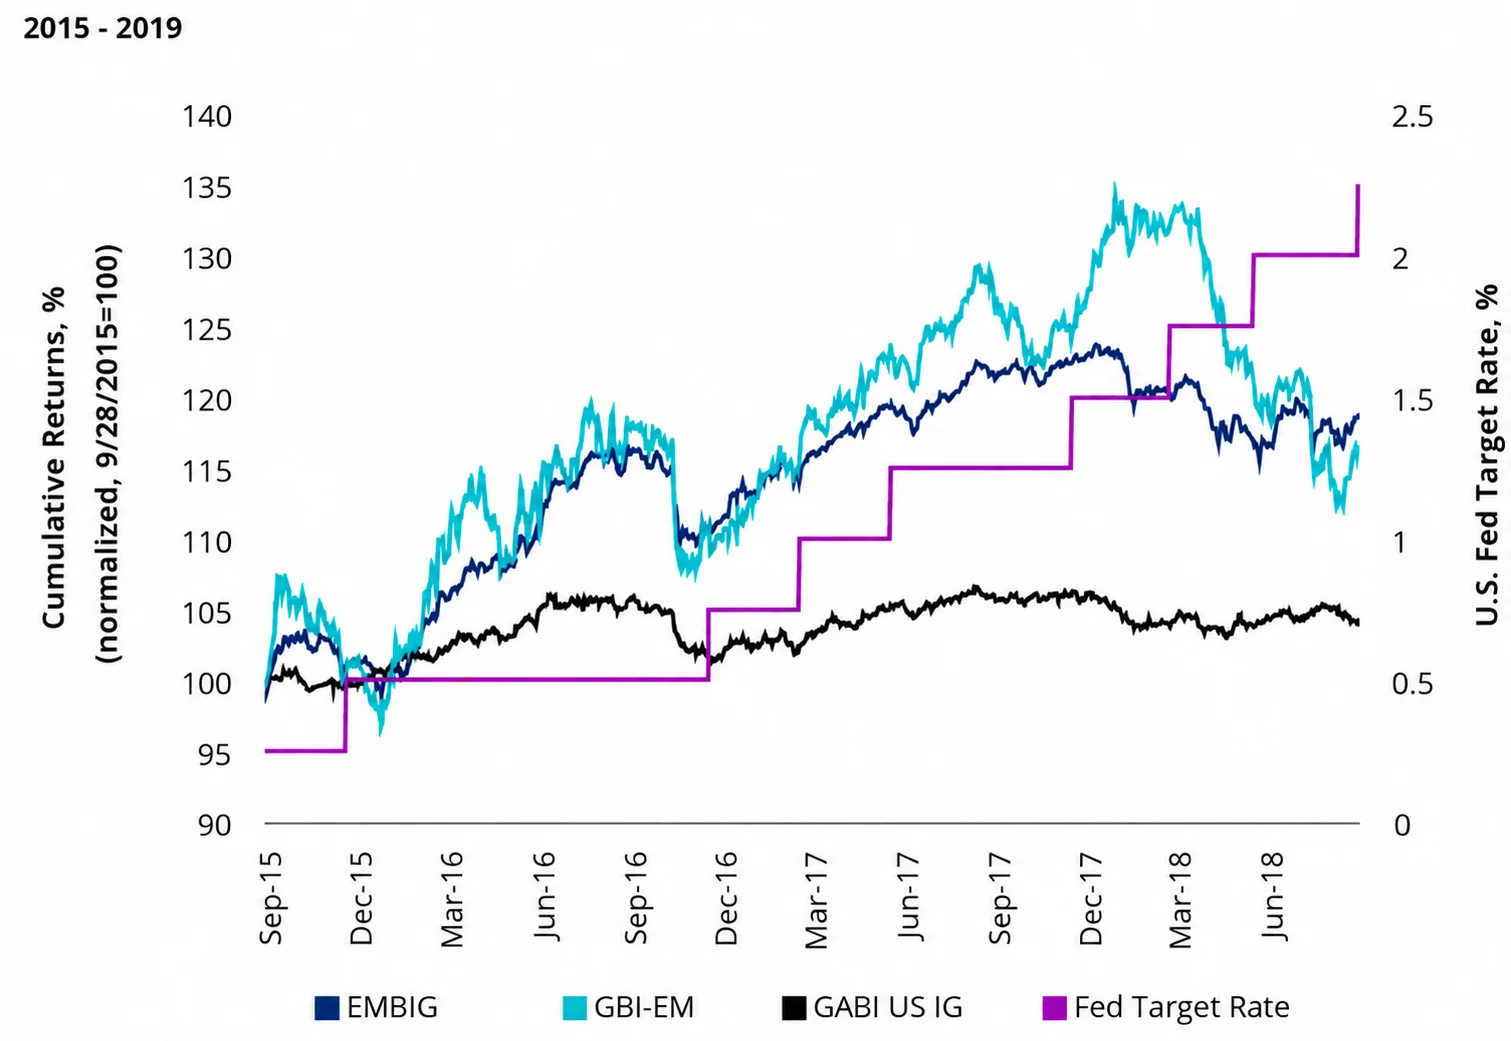
Source: IMF. EMBIG is the J.P. Morgan Emerging Markets Bond Index Global Index. GBI-EM is the J.P. Morgan Government Bond Index-Emerging Markets Index. GABI US IG is the J.P. Morgan Global Aggregate Bond Index US Investment Grade. You cannot invest in an index. Past performance is not indictive of future performance.
Those earlier cycles were supported at points by stronger global growth and attractive income. Today, US yields are rising due to energy-driven inflation and heavy government borrowing, making the backdrop less forgiving. The case for EM debt therefore rests on the stronger starting conditions in many countries, which the following sections examine.
Four reasons to consider EM bonds as global rates rise
1. The fundamentals have improved
Governments have reduced their dependence on foreign currency borrowing and built deeper local bond markets. Today, data from the Bank of International Settlements (BIS) suggests more than 90% of all outstanding emerging market debt is now denominated in local currencies and the size of this market is roughly the same as the entire US corporate debt market.
Central banks in these economies have adopted inflation targets and shown greater willingness to confront price pressures. Several Latin American central banks began raising rates in 2021, before the US Federal Reserve, giving them a head start in controlling inflation.
2. Parts of EM are further ahead in the rate cycle
Earlier tightening has allowed some EM central banks to begin reducing rates as inflation moves back towards target. The scope has been strongest in markets where inflation is subdued, and real interest rates remain high.
Several developed economies, including Australia, face the opposite problem. Persistent inflation and fiscal pressure may keep policy settings restrictive for longer, even as economic growth slows.
Chart 4: Asia inflation now persistently lower than the US
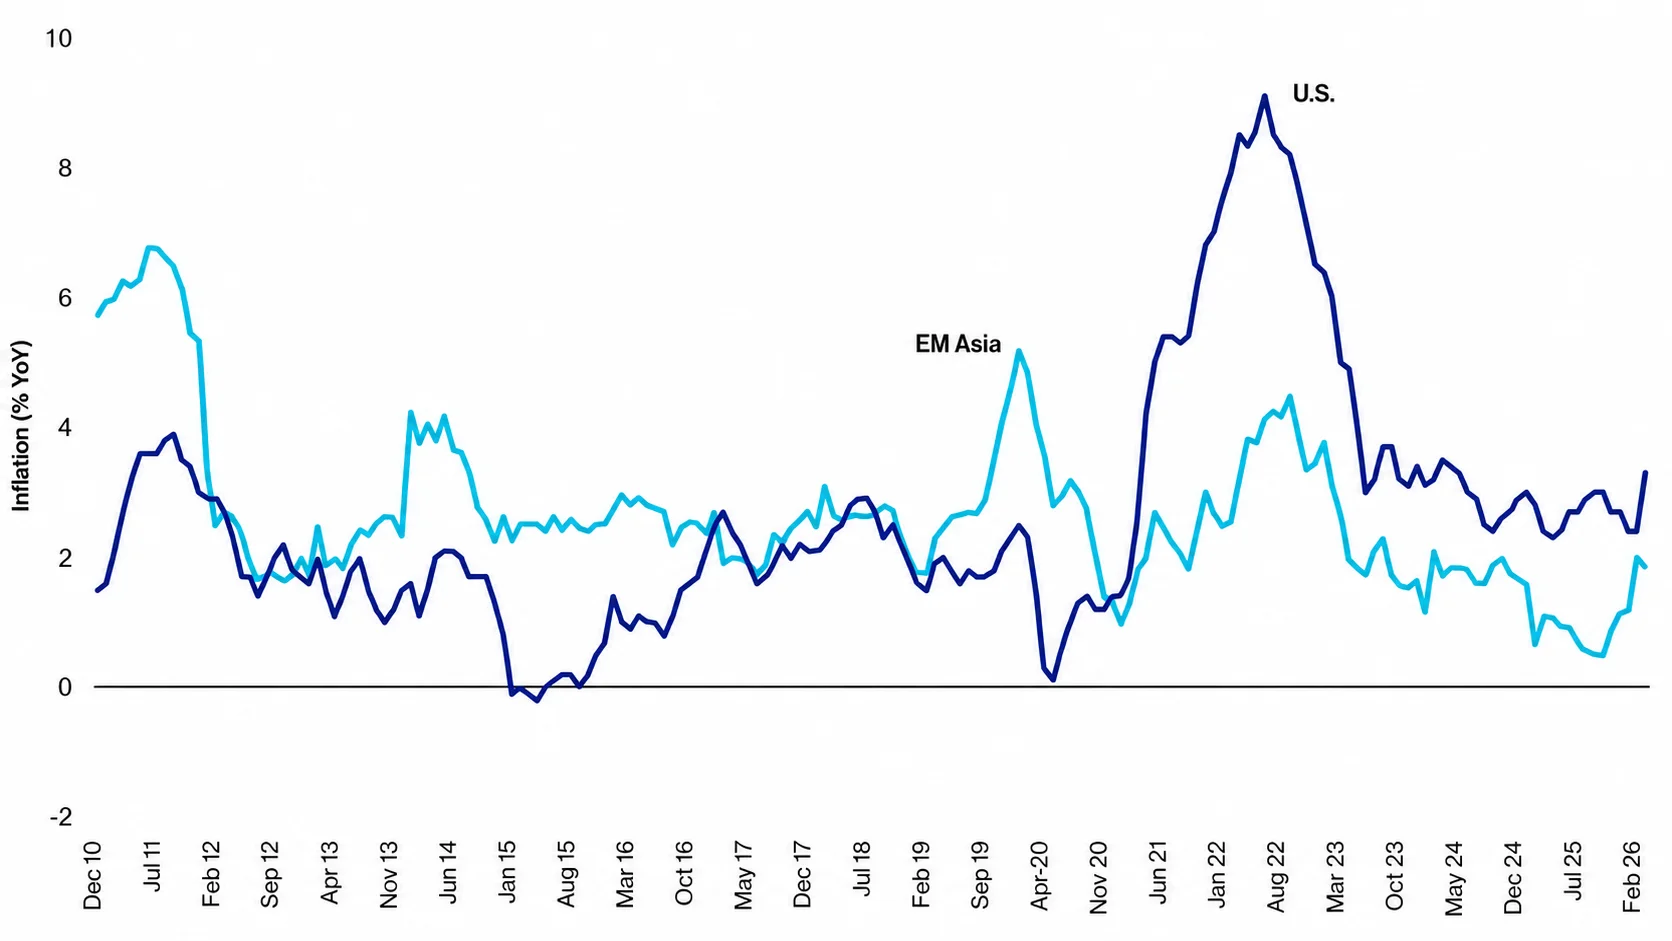
Source: VanEck Research: Bloomberg LP, Data as of 31 May 2026.
3. External balance sheets favour several emerging economies
Several large emerging economies, many of them in Asia, now own more assets abroad than foreign investors own in their economies.
The US is in the opposite position, with foreign holdings of American assets exceeding US holdings overseas. This gives creditor countries a financial buffer and reduces their dependence on foreign capital when global markets come under pressure.
4. Government debt is lower across much of EM
The IMF expects government debt across advanced economies excluding the US to reach 94.4% of GDP in 2026, compared with 58.5% for emerging markets excluding China. Higher debt burdens can raise refinancing costs and constrain policy choices as interest rates increase.
Chart 5: General government gross debt, % of GDP
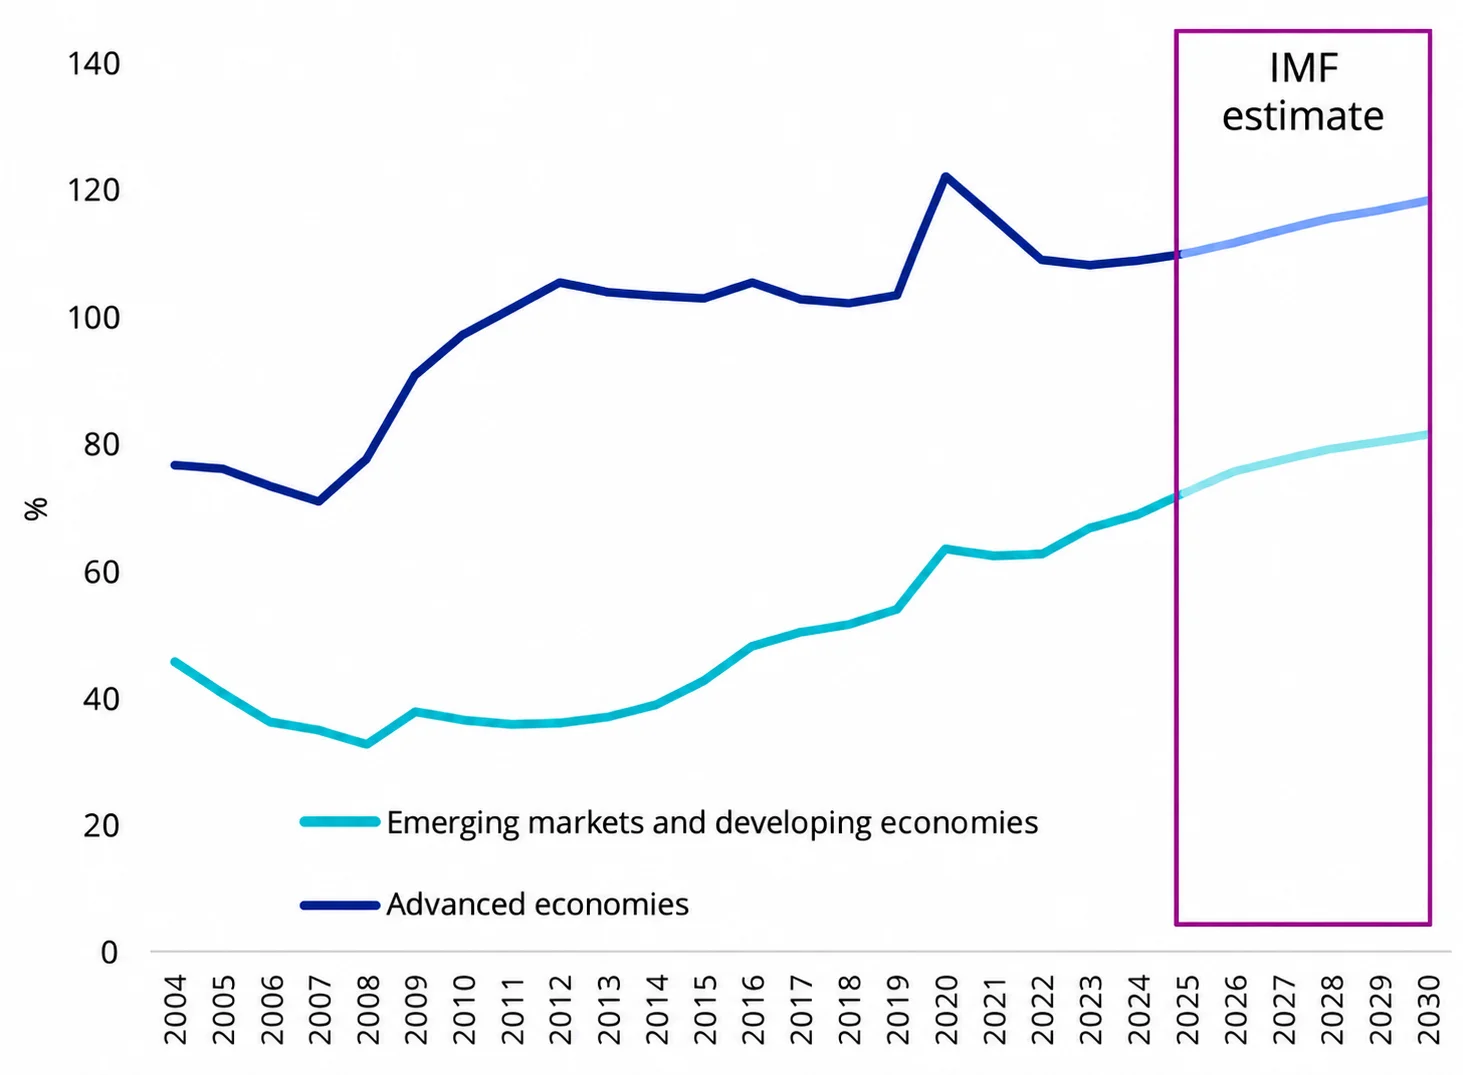
Source: International Monetary Fund. Figures from 2026 are IMF projections. The EM aggregate includes China, whose trajectory accounts for a substantial share of the post-2020 increase.
Why take an active, blended approach
Emerging market debt spans local-currency sovereign bonds, hard-currency sovereign debt and corporate issuers, each driven by a different mix of rates, currencies and credit risk. An active, blended approach can move across these segments as relative value changes rather than accept a fixed benchmark allocation.
The VanEck Emerging Income Opportunities Active ETF (EBND) searches for bonds whose yields appear attractive relative to the issuer’s fundamentals. A quantitative model then helps pinpoint political, economic and other risks that data may not capture before risk limits shape the final portfolio. The fund typically holds between 50 to 150 bonds from 50 to 100 issuers across 35 to 70 countries.
EBND performance
EBND gives Australian investors access to this active, blended portfolio through a single ASX trade with the added benefit of monthly distributions.
As at 31 August 2026, the fund had outperformed its blended benchmark over six months, one year, three years, five years and since inception. It lagged over the latest one- and three-month periods.
Table 1: EBND trailing returns
| 1 month | 3 months | 6 months | 1 year | 3 years p.a. | 5 years p.a. | Since inception p.a. | |
| EBND total return | -0.31% | 0.80% | 0.04% | 4.23% | 7.97% | 4.05% | 3.68% |
| Benchmark | -0.09% | 1.11% | -0.24% | 3.05% | 6.65% | 1.97% | 1.10% |
| Difference | -0.22% | -0.31% | +0.28% | +1.18% | +1.32% | +2.08% | +2.58% |
Source: VanEck, as at 31 August 2026. EBND’s benchmark is 50% J.P. Morgan Emerging Market Bond Index Global Diversified Hedged AUD and 50% J.P. Morgan Government Bond-Emerging Market Index Global Diversified. Fund performance is calculated from its inception on 11 February 2020 and assumes the reinvestment of distributions. Returns are net of management fees and costs, but before brokerage fees or bid-ask spreads incurred when investors trade on ASX. Returns for periods longer than one year are annualised. Past performance is not indicative of current or future performance, which may be lower or higher. You cannot invest in an index.
A different starting point
A 5% Treasury yield is a high hurdle, but it is also evidence of the inflation and fiscal pressures being priced into developed markets. EM debt is not a monolithic asset class, so the case rests on selecting countries, currencies and securities where stronger fundamentals and higher income justify the risks. As we have argued for years, the old label no longer fits.
Key risks
An investment in the Fund carries risks associated with: ASX trading time differences, emerging markets bonds and currencies, bond markets generally, interest rate movements, issuer default, currency hedging, credit ratings, country and issuer concentration, liquidity, fund manager and fund operations. See the VanEck Emerging Income Opportunities Active ETF PDS and TMD for more details.
EBND is likely to be appropriate for a consumer who is seeking capital growth and a regular income distribution, is intending to use the product as a minor or satellite allocation within a portfolio, has an investment timeframe of at least 5 years, and has a very high risk/return profile.


Published: 24 September 2026
Any views expressed are opinions of the author at the time of writing and is not a recommendation to act.
VanEck Investments Limited (ACN 146 596 116 AFSL 416755) (VanEck) is the issuer and responsible entity of all VanEck exchange traded funds (Funds) trading on the ASX. This information is general in nature and not personal advice, it does not take into account any person’s financial objectives, situation or needs. The product disclosure statement (PDS) and the target market determination (TMD) for all Funds are available at vaneck.com.au. You should consider whether or not an investment in any Fund is appropriate for you. Investments in a Fund involve risks associated with financial markets. These risks vary depending on a Fund’s investment objective. Refer to the applicable PDS and TMD for more details on risks. Investment returns and capital are not guaranteed.