5 charts that highlight the transformation in these stocks


An emerging markets allocation buys a different mix of businesses from the one it bought 30 years ago. These five charts show how the countries, sectors and companies have changed, and why investors may need to revisit the assumptions behind their exposure.
Chart 1: The changing country mix
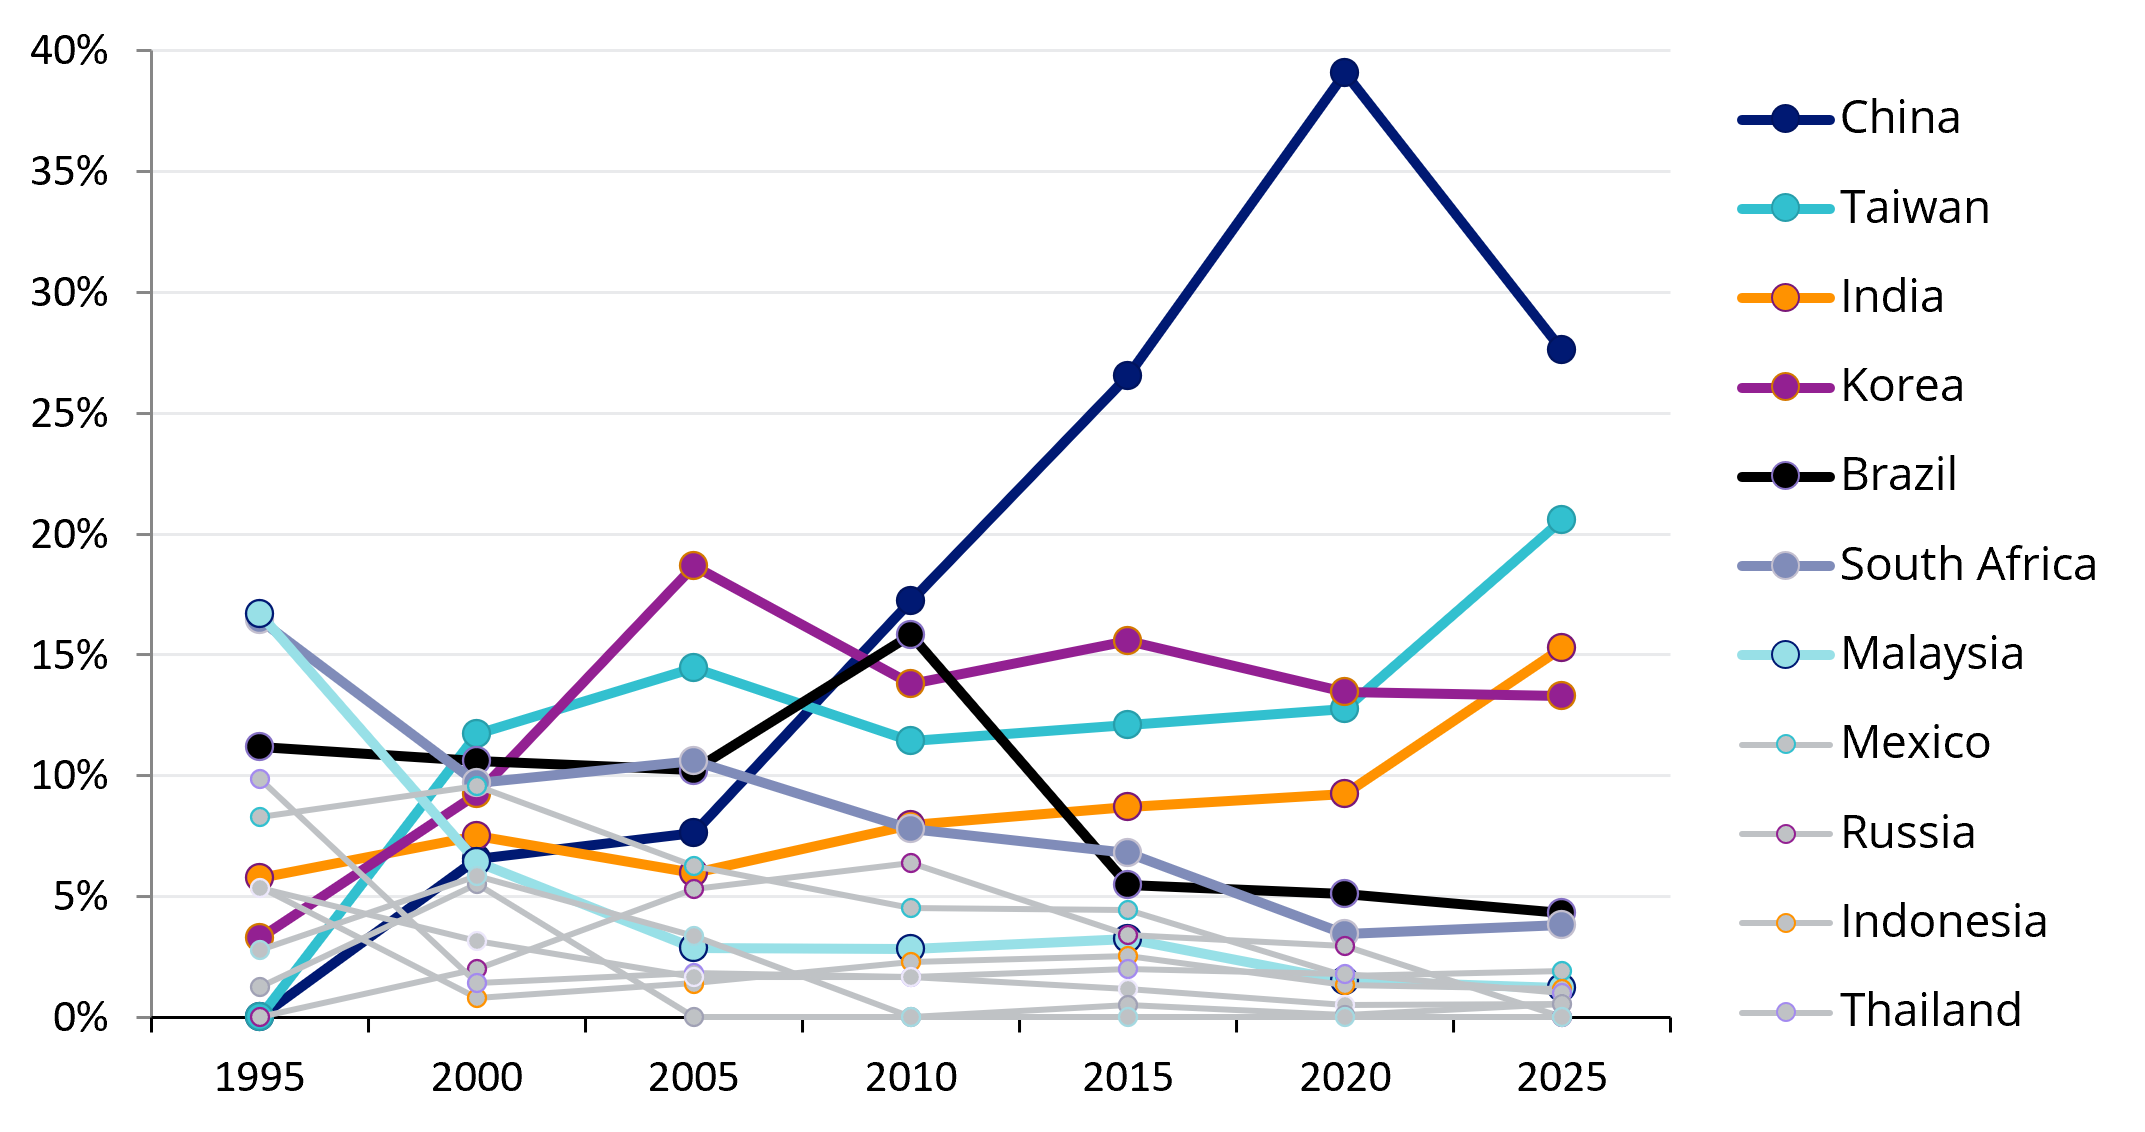
Source: MSCI, MSCI Emerging Markets Index year-end constituent data (31 Dec). Weights are point-in-time. Past composition is not a guide to the future. Countries shown reached at least 4% at one of these year-ends. 0.0% means the country was not in the index at that date (China, Taiwan and Russia in 1995; Russia and Israel in 2025).
The emerging market universe, and the countries classified as emerging economies, change all the time. When the MSCI Emerging Markets Index was launched in 1988, there were 10 countries represented with Malaysia and Brazil together representing over half of the index. Today, Brazil is 4% of the index while Malaysia makes up over 1%.
China, now the most significant single county in the benchmark, was not admitted until September 1996. As at the end of 2025, there are four Chinese companies in the top 10 from the financials, communications services and consumer discretionary sectors.
Chart 2: From materials and telecoms to technology
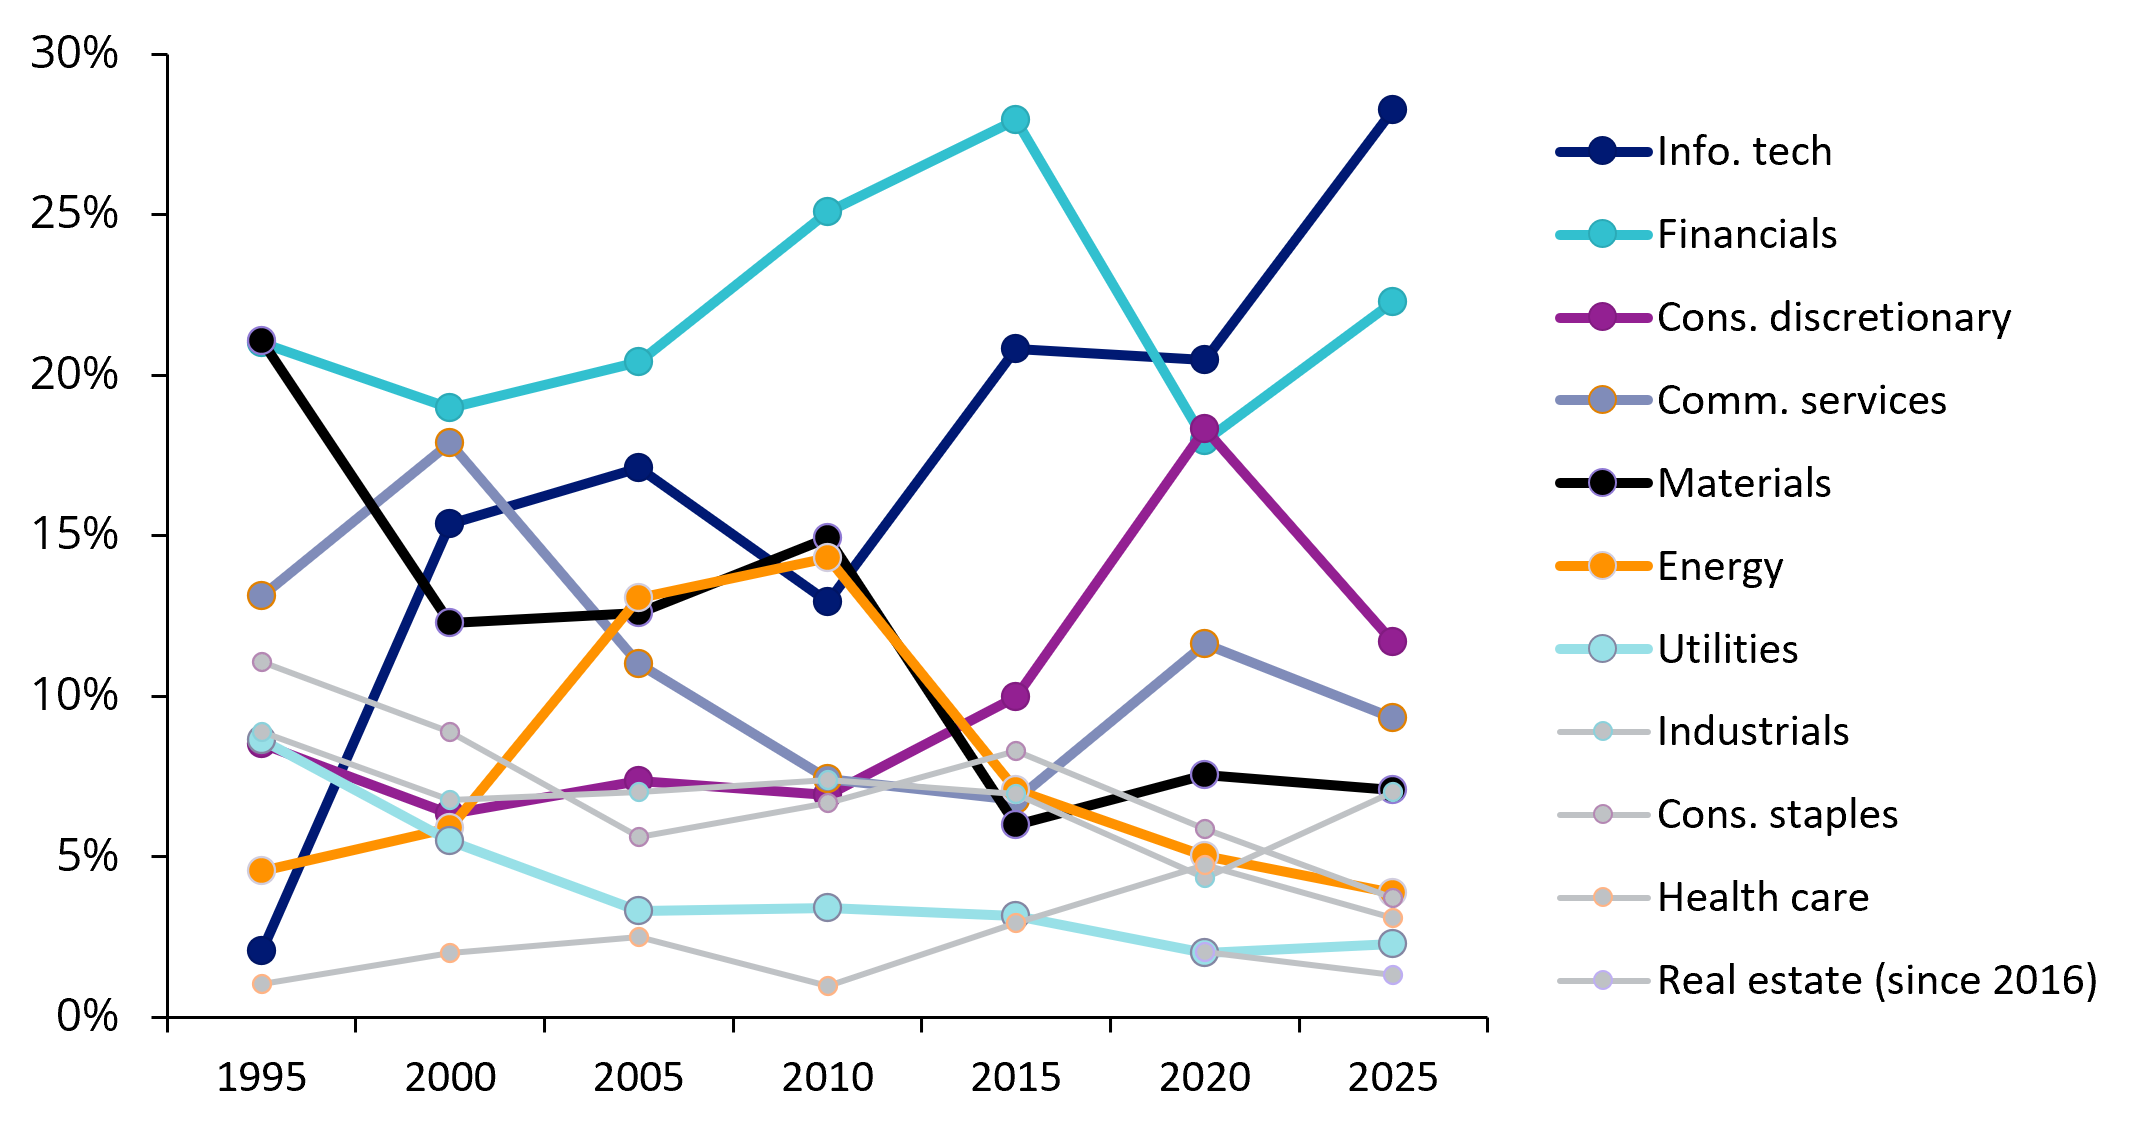
Source: MSCI, MSCI Emerging Markets Index year-end constituent data (31 Dec). Weights are point-in-time. Not restated for GICS changes. Real Estate was split from Financials in 2016. In 2018 Telecommunication Services became Communication Services and took internet and media names from the Information Technology and Consumer Discretionary sectors.
For most of the 21st century, emerging markets have been seen as a tactical play that was dependent on two inter-dependent factors, commodity exports and the US dollar.
Many emerging economies flourish or perish based on exports. If exports were rising in aggregate, chances are that the price of key commodities such as crude oil, iron ore and copper were also rising, affecting the earnings of some of the index’s largest companies and the strength of their local currencies against the US dollar. This is why emerging markets equities tend to rise when the US dollar is falling.
But for reasons that we will discuss later that old story has changed.
Chart 3: MSCI EM’s Top 10
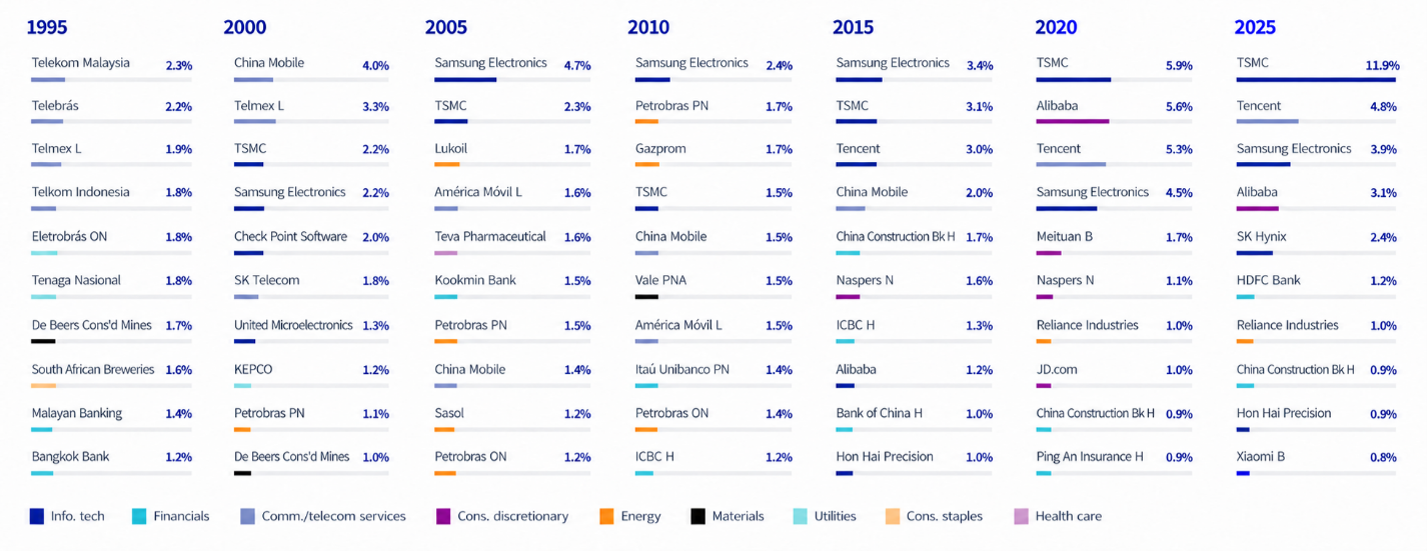
Source: MSCI, MSCI Emerging Markets Index year-end constituent data (31 Dec). Weights are point-in-time.
30 years ago, the four biggest companies in the emerging markets universe were all (at one time or another) state-owned telecommunications monopolies. But they have been gradually superseded by technology giants and consumer names.
Some of these names entered the Top 10 in 2000 and are still there: TSMC and Samsung for instance. Others, such as Petrobras and China Mobile, were once among the index’s top 10 but later dropped out of that group.
Others yet reflect their respective economic cycles, which is how Chinese banks featured throughout the 2010s but were then replaced in the top 10 by Indian-domiciled HDFC Bank as the subcontinent’s economy began to gather steam.
Chart 4: EM equities’ changing sensitivity to the US dollar
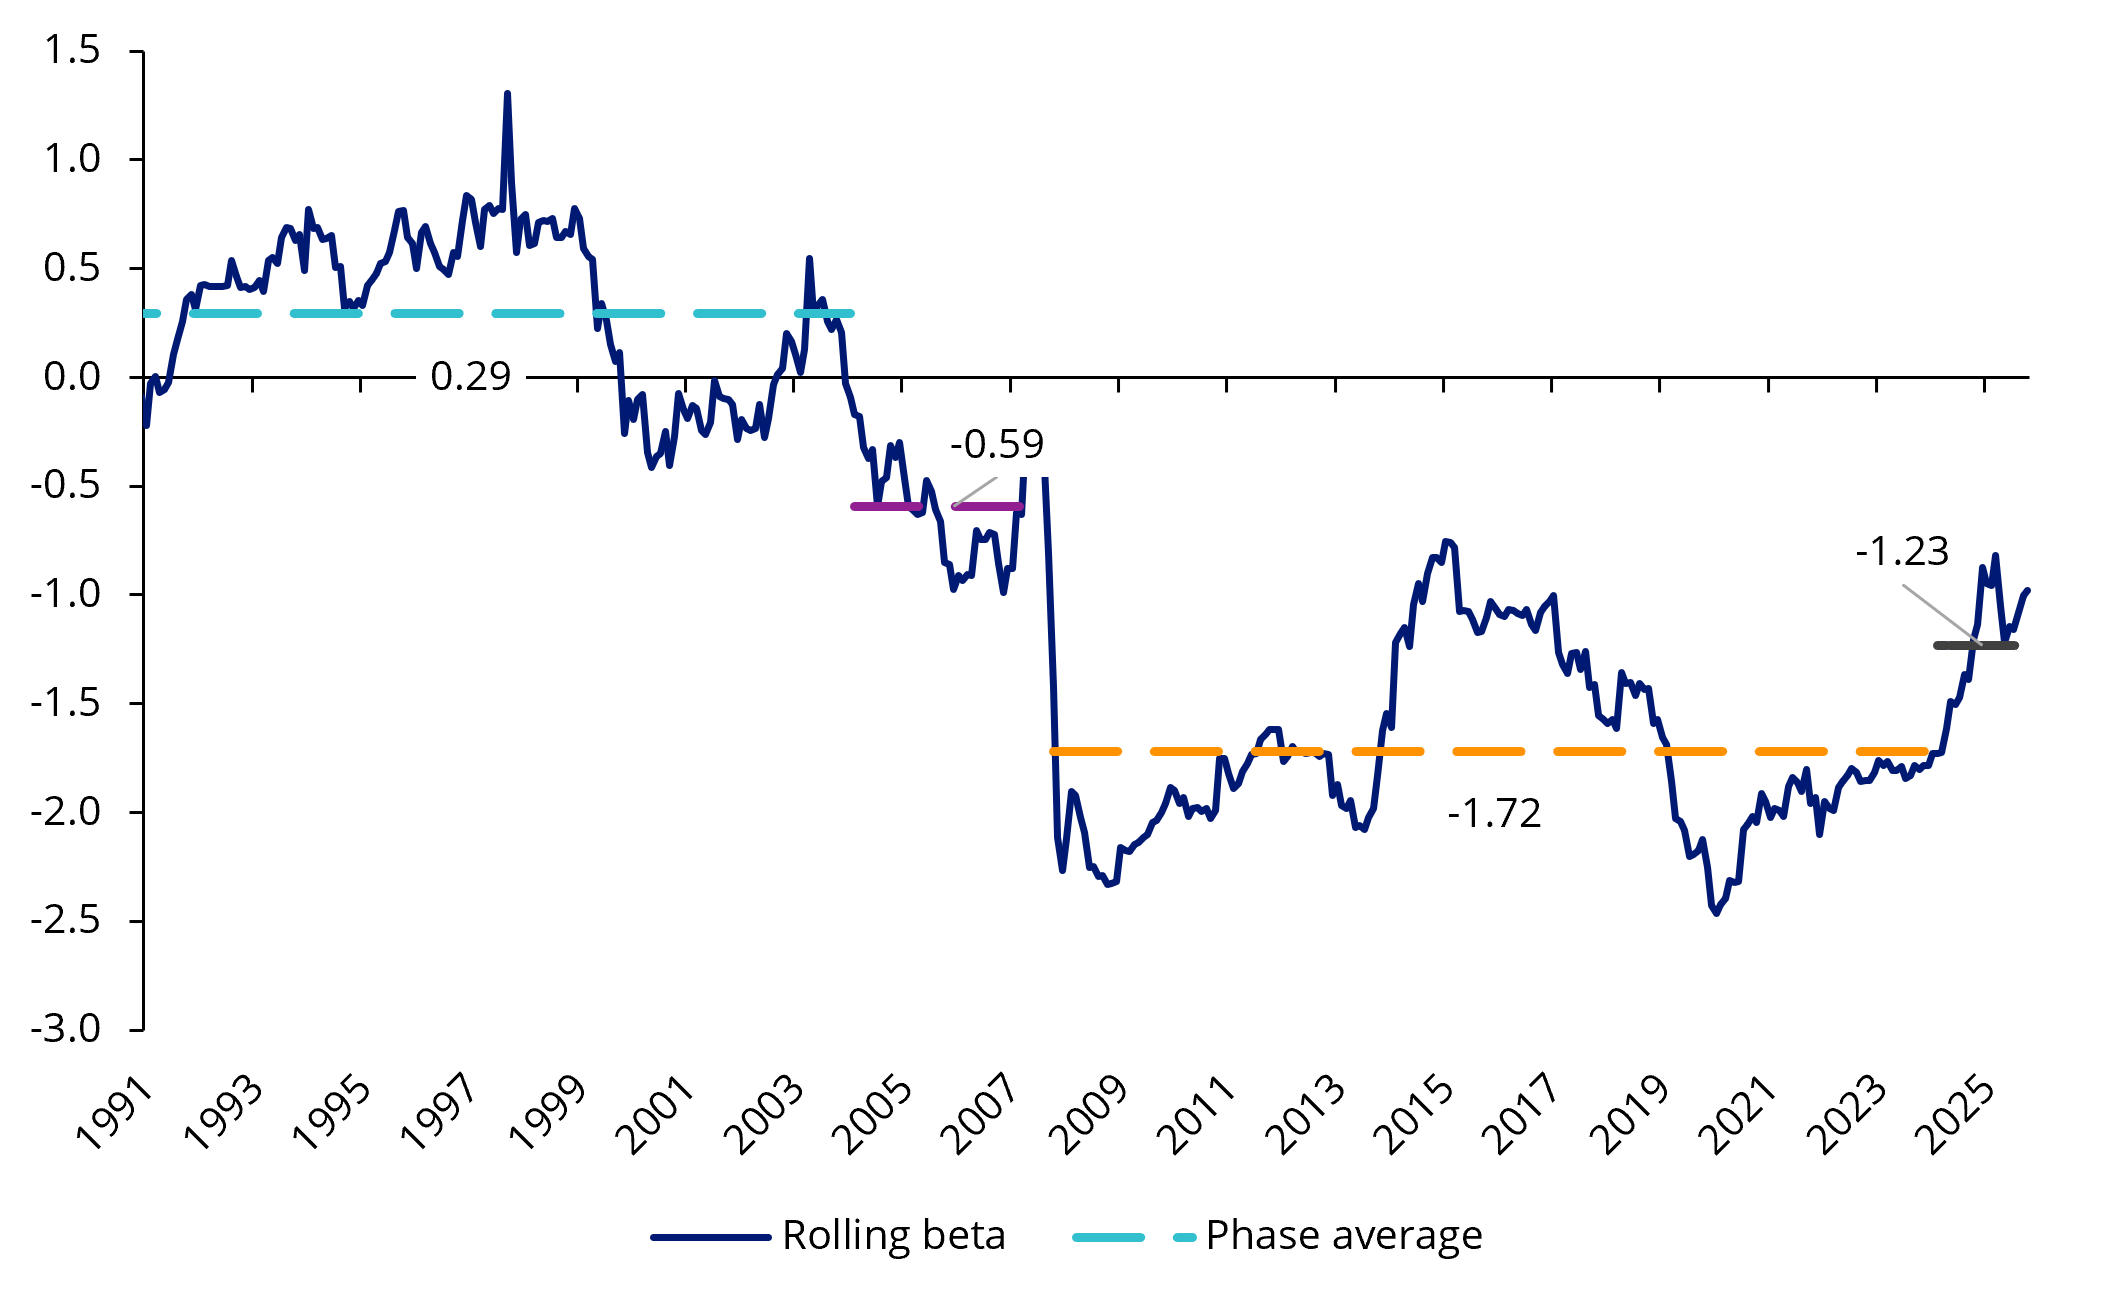
Source: Bloomberg as at 29 September 2026. EM equities is MSCI Emerging Markets Index. USD Index measures the strength of the US Dollar against major world currencies. Past performance is not indicative of future performance. You cannot invest directly in an index.
While it is true that the US dollar has a significant influence on the returns of emerging market stocks, that influence is much more nuanced than many give it credit.
From the 1990s to the mid-2000s, EM equities tended to rise slightly with the US dollar, and the correlation score was positive but low, as the aqua line shows. During this era, many EM currencies were pegged or tightly managed against the US dollar meaning any returns were dominated by local crises rather than dollar moves.
Between 2005 and 2008, the era defined by the purple line, correlation dropped into negative territory as the commodities boom tied EM performance to a weak dollar.
Between 2008 and the mid-2020s, noted here as the orange line, the correlation sank even further as the US dollar began to act as a global “risk off” gauge. However, since the AI trade took off, correlation has risen back to levels not seen since 2008. This may suggest that country and sector-specific drivers are once again the bigger influence over emerging market returns, not the US dollar.
Chart 5: Where the earnings are
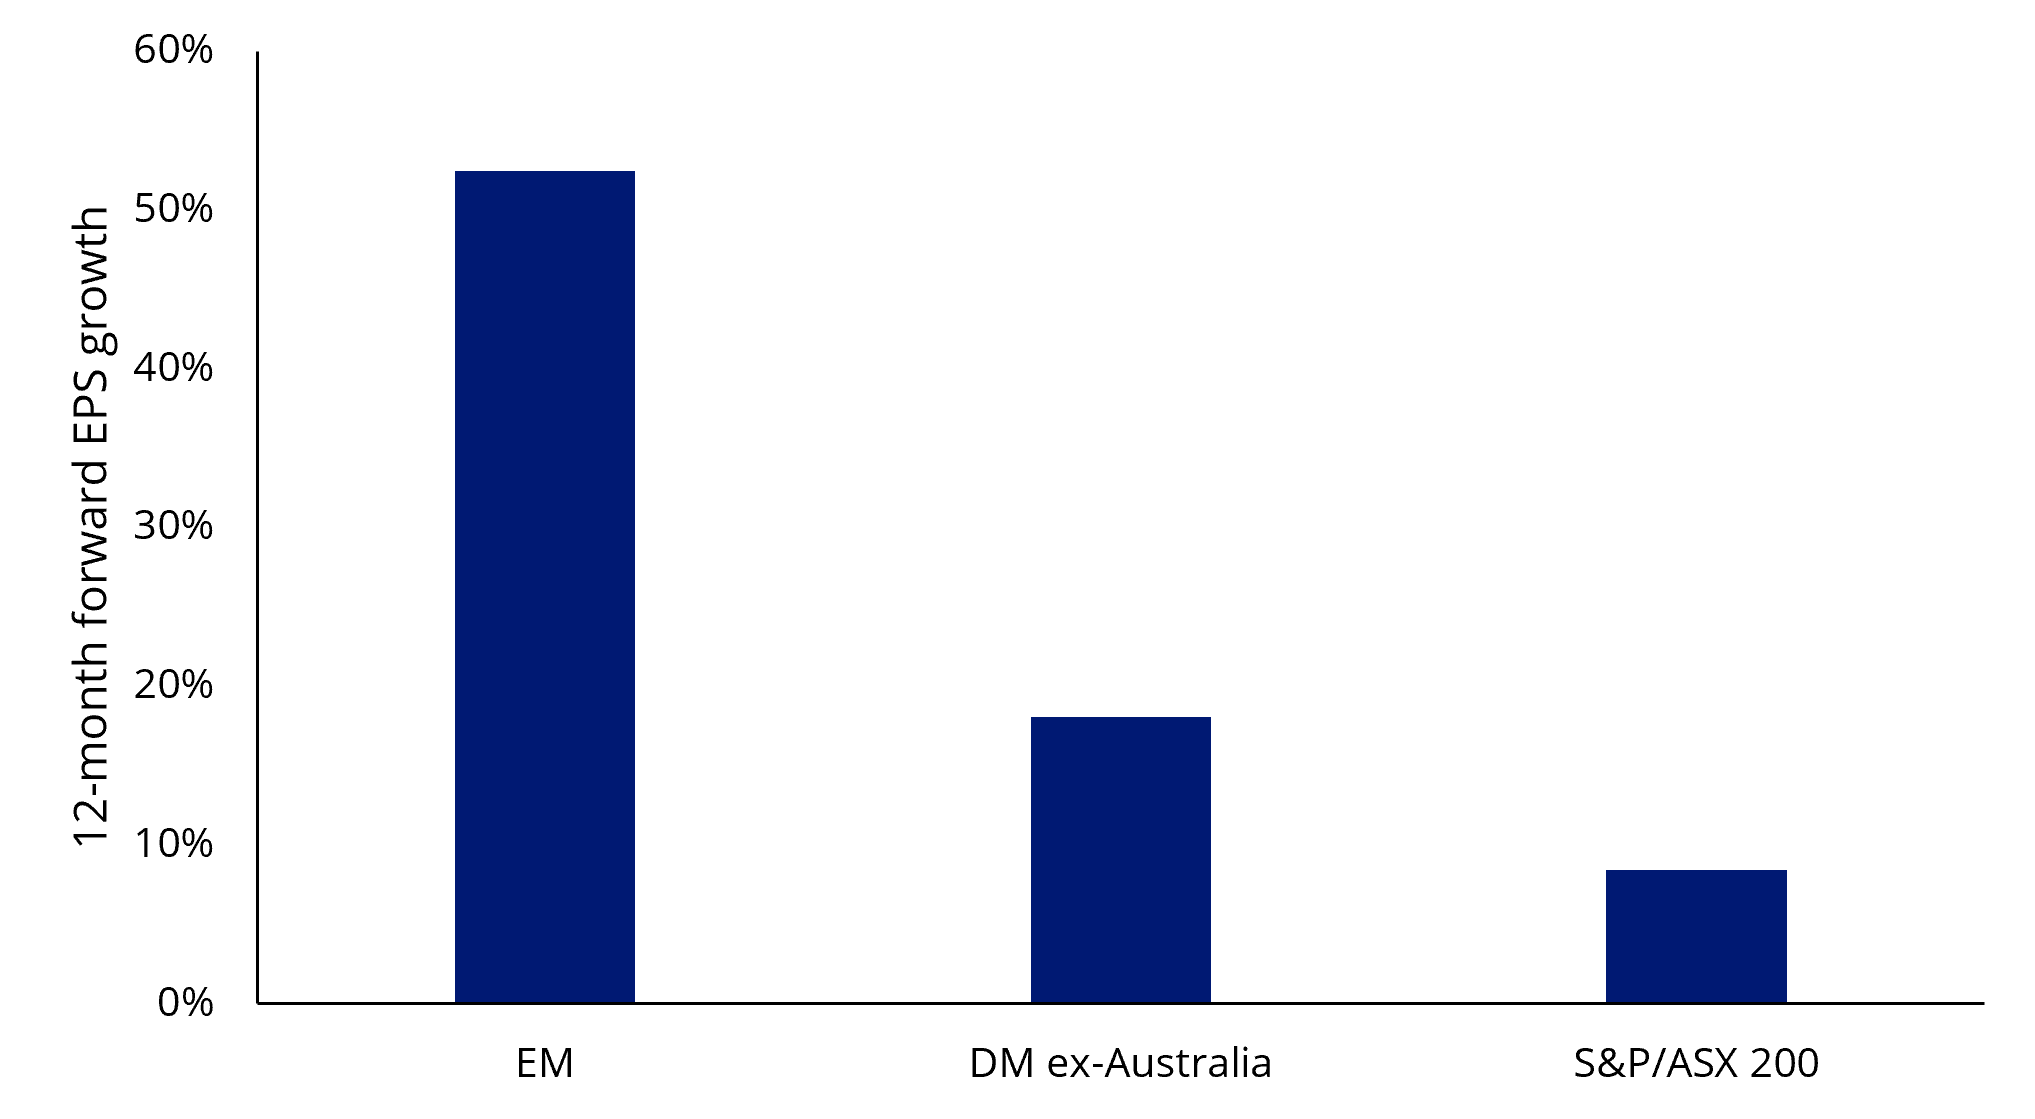
Source: Bloomberg, 12-month forward earnings estimates used. As at 16 October 2026. DM ex-Australia is the MSCI World ex-Australia Index. EM is the MSCI Emerging Markets Index.
Analysts forecast emerging markets earnings per share growth of 52.5%, compared with 18% for developed markets excluding Australia and 8.4% for the S&P/ASX 200.
Put a different way, EPS growth expectations for emerging market stocks are roughly six times that of Australian companies. For investors whose portfolios are concentrated at home, that is a growth opportunity worth considering.
Investment implications
Today's emerging markets index is dominated by North Asian technology giants such as TSMC and Samsung, a far cry from the commodity proxy of the past.
Investors who simply own the index also own the risks that come with an index that is dominated by three stocks and two sectors.
In our view, that makes holding emerging markets compelling but an approach beyond the standard index, more so.
When it comes to emerging market equity investing the widely used benchmark is the MSCI Emerging Markets Index. Investing in emerging markets is often associated with being expensive because brokerage fees are higher and navigating them require more specialist knowledge, so many investors have been happy to pay higher fees, often beyond 1% per annum, to have a professional investor select the best emerging markets opportunities.
Innovations in index design for passive funds are delivering above market benchmark returns over the long term while retaining low costs.
It is this approach VanEck offers in emerging market equities. The VanEck MSCI Multifactor Emerging Markets Equity ETF (ASX: EMKT) provides investors with diversified access to companies that demonstrate four factors: Value, Momentum, Low Size and Quality. We think that because of the many different economic cycles within emerging markets and the return dispersion between countries a multi factor approach is a prudent approach in emerging markets.
While past performance is not indicative of future performance, we think these results highlight the potential benefits of combining multiple factors within the fast-evolving emerging markets universe.
Table 1: Performance as at 30 September 2026
|
YTD (%) |
1 year (%) |
3 Years (% p.a.) |
5 Years (% p.a.) |
7 Years (% p.a.) |
Since the EMKT inception date# (% p.a.) |
|
|---|---|---|---|---|---|---|
|
EMKT |
31.57 |
40.92 |
27.09 |
16.34 |
14.83 |
11.51 |
|
MSCI Emerging Markets Index |
18.27 |
23.10 |
21.02 |
9.76 |
9.96 |
8.43 |
|
Difference |
+13.30 |
+17.82 |
+6.07 |
+6.58 |
+4.87 |
+3.08 |
Source: VanEck, Morningstar Direct
# EMKT inception date is 10 April 2018 and a copy of the factsheet is here.
Performance is calculated net of management fees, calculated daily but does not include brokerage costs or buy/sell spreads of investing in EMKT. Past performance is not indicative of future performance.
There is no doubt that emerging markets, have been at the forefront of innovation with some of the fastest growing technology firms listing on emerging market exchanges. Emerging markets are growing in size and influence, and their composition is also evolving. Investing in emerging markets can be risky. That is why it is prudent to an approach that considers multiple factors.
Key risks
An investment in our emerging markets ETF carries risks associated with: ASX trading time differences, emerging markets, financial markets generally, individual company management, industry sectors, foreign currency, country or sector concentration, political, regulatory and tax risks, fund operations, liquidity and tracking an index. See the VanEck MSCI Emerging Markets Equity ETF PDS and TMD for more details.
Who is EMKT suitable for?
EMKT is likely to be appropriate for a consumer who is seeking capital growth, is intending to use the product as a core, minor or satellite allocation within a portfolio, has an investment timeframe of at least 5 years, and has a high risk/return profile.


Published: 16 October 2026
The MSCI Emerging Markets Index (“MSCI EMI”) is shown for comparison purposes as it is the widely recognised benchmark used to measure the performance of emerging markets large- and mid-cap companies, weighted by market capitalisation. EMKT’s index measures the performance of emerging markets companies selected on the basis of their exposure to value, momentum, low size and quality factors, while maintaining a total risk profile similar to that of the MSCI EMI, at rebalance. EMKT’s index has fewer companies and different country and industry allocations than MSCI EMI. Click here for more details
Any views expressed are opinions of the author at the time of writing and is not a recommendation to act.
VanEck Investments Limited (ACN 146 596 116 AFSL 416755) (VanEck) is the issuer and responsible entity of all VanEck exchange traded funds (Funds) trading on the ASX. This information is general in nature and not personal advice, it does not take into account any person’s financial objectives, situation or needs. You should consider whether or not an investment in any Fund is appropriate for you. Investments in a Fund involve risks associated with financial markets. These risks vary depending on a Fund’s investment objective. Refer to the applicable product disclosure statement (PDS) and target market determination (TMD) available at vaneck.com.au for more details. Investment returns and capital are not guaranteed.