A perfect storm is brewing for Australian income investors


A perfect storm is arguably brewing for Australian income investors – not just from a government policy standpoint but from a markets one too.
On the back of renewed global inflation concerns, Australian 10-year yields have risen to around 5.2% at the time of writing. This is the highest level seen this year and close to levels last observed in 2011.
Much of the move has been global, with long-dated yields rising across developed markets. Persistent inflation has kept term premia elevated, while the US-Iran conflict has added a further supply-side shock through higher energy prices. Australia has also faced its own inflation pressures, which were already elevated before the conflict.
Chart 1: Australia 10-year yield
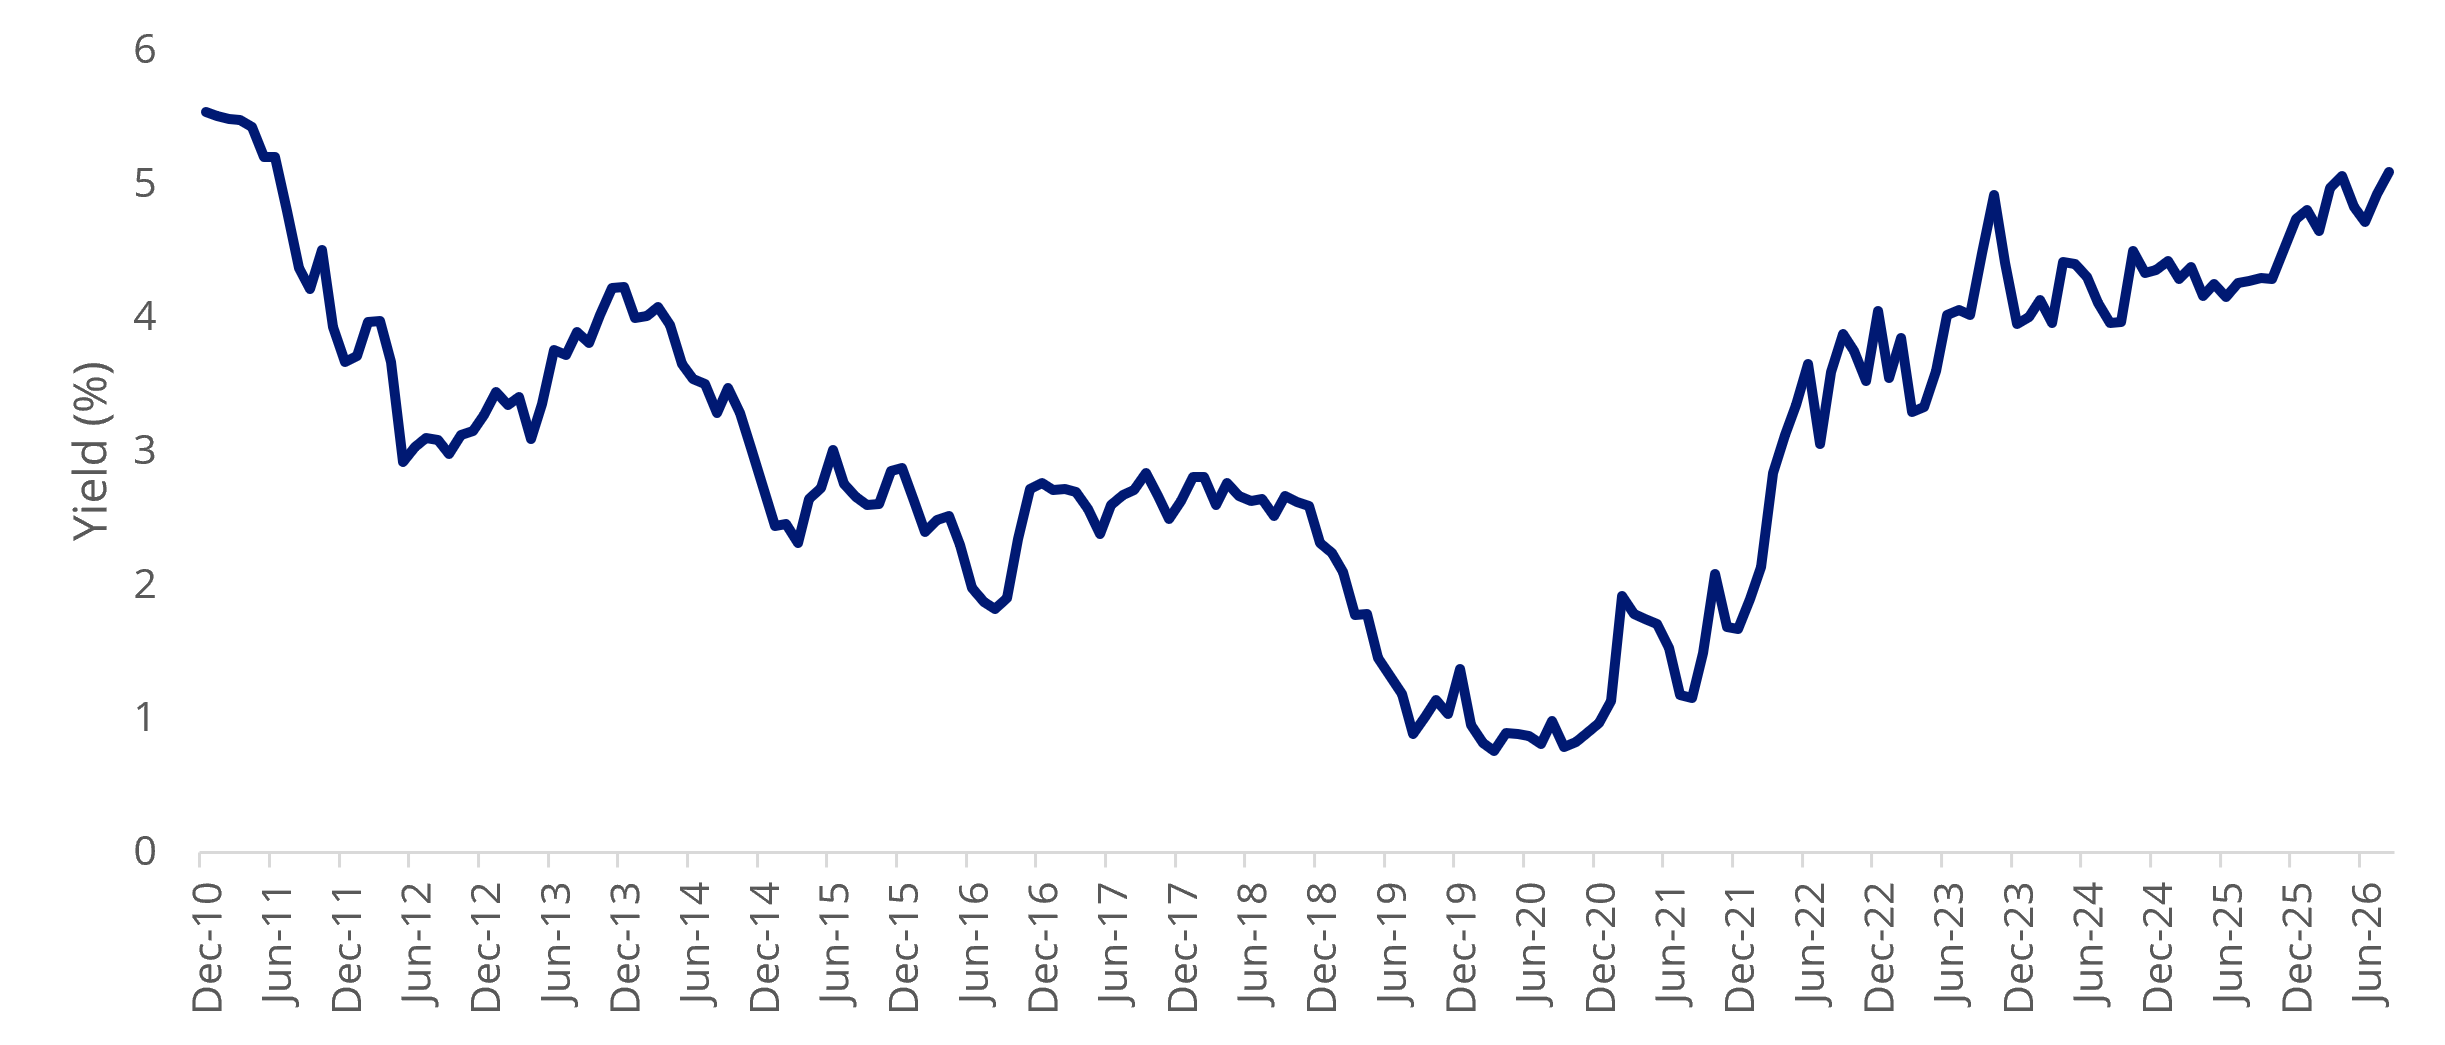
Source: Bloomberg, 9 September 2026.
Against this backdrop, there is a 70% chance of a RBA hike in September with rates markets pricing close to two total hikes by mid-2027. Trimmed mean inflation, which measures price increases excluding volatile items such as food and petrol, remains well above the RBA’s target band, even before accounting for the additional pressure from recent wage increases. With underlying inflation already elevated, these wage increases should keep domestic cost pressures firm and make a sustained return to target more difficult. Domestic bond yields have risen materially to reflect these risks.
Chart 2: Australia Inflation Year on Year
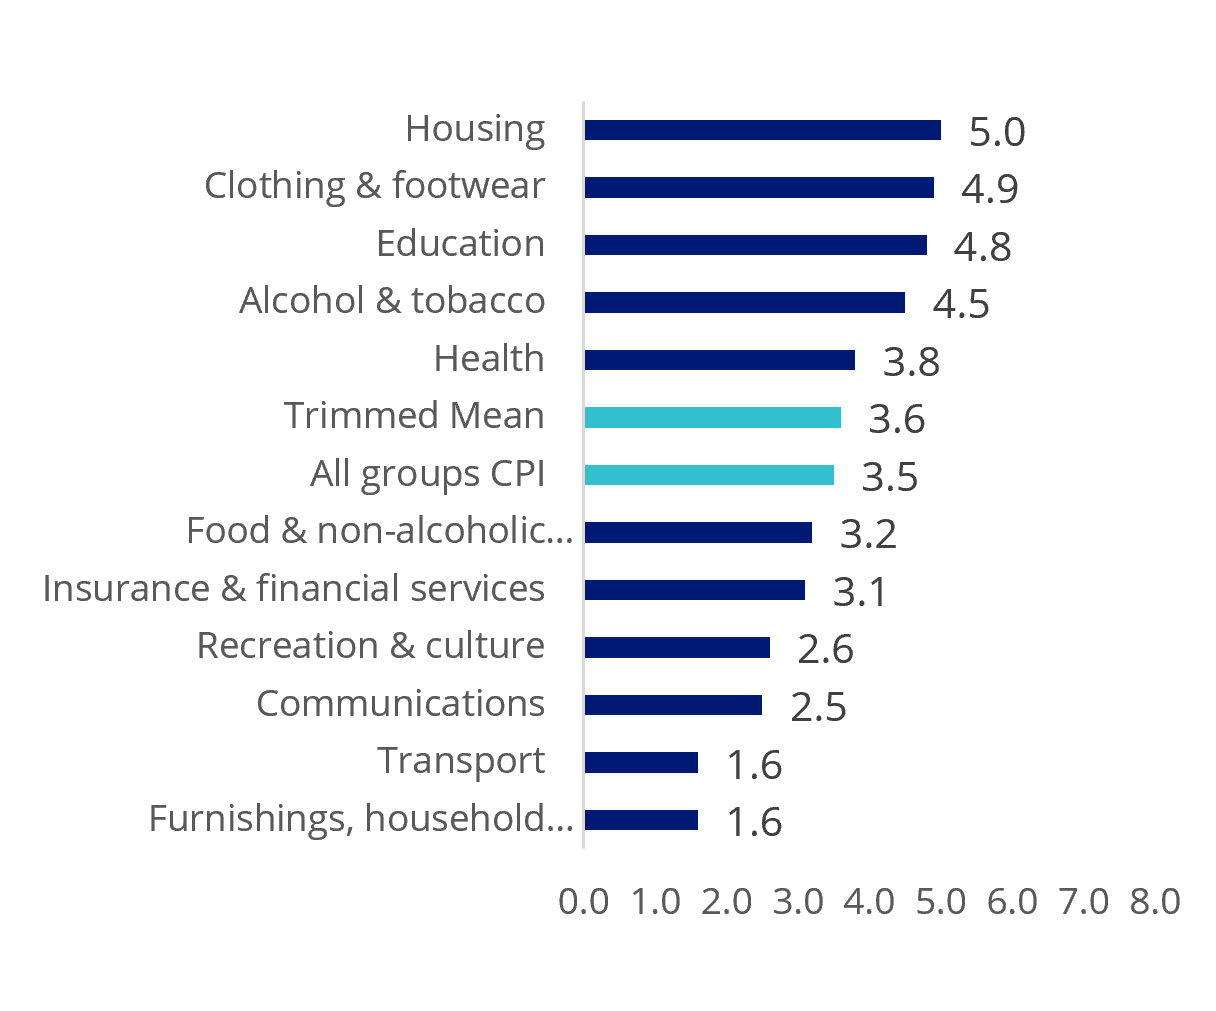
Source: ABS, 31 July 2026.
Chart 3: Australia Min Wage Growth versus Inflation
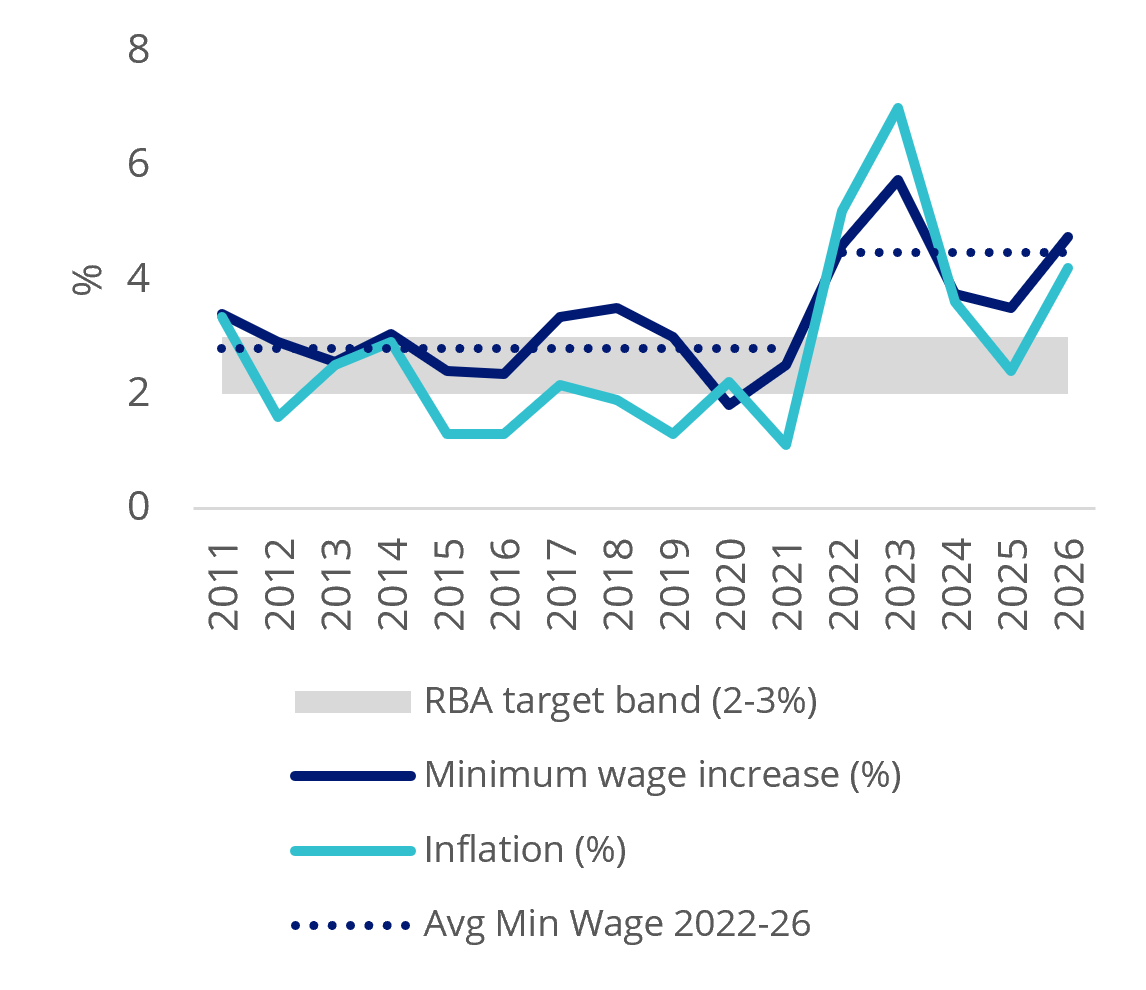
Source: Bloomberg, 31 August 2026.
For investors, the key question is how best to capitalise on the opportunities created by this significant repricing in interest rates.
The setup
In our view, three outcomes are plausible. Persistent inflation and rising offshore term premia (the uncertainty fee that investors demand for locking up money in a long-term bond) could push yields significantly higher from current levels. Alternatively, yields could instead remain around current levels if inflation stays firm, but growth softens enough to limit further tightening. A third scenario would occur if a sharper growth slowdown would create scope for inflation to ease and yields to fall more materially. Each scenario favours different portfolio positioning.
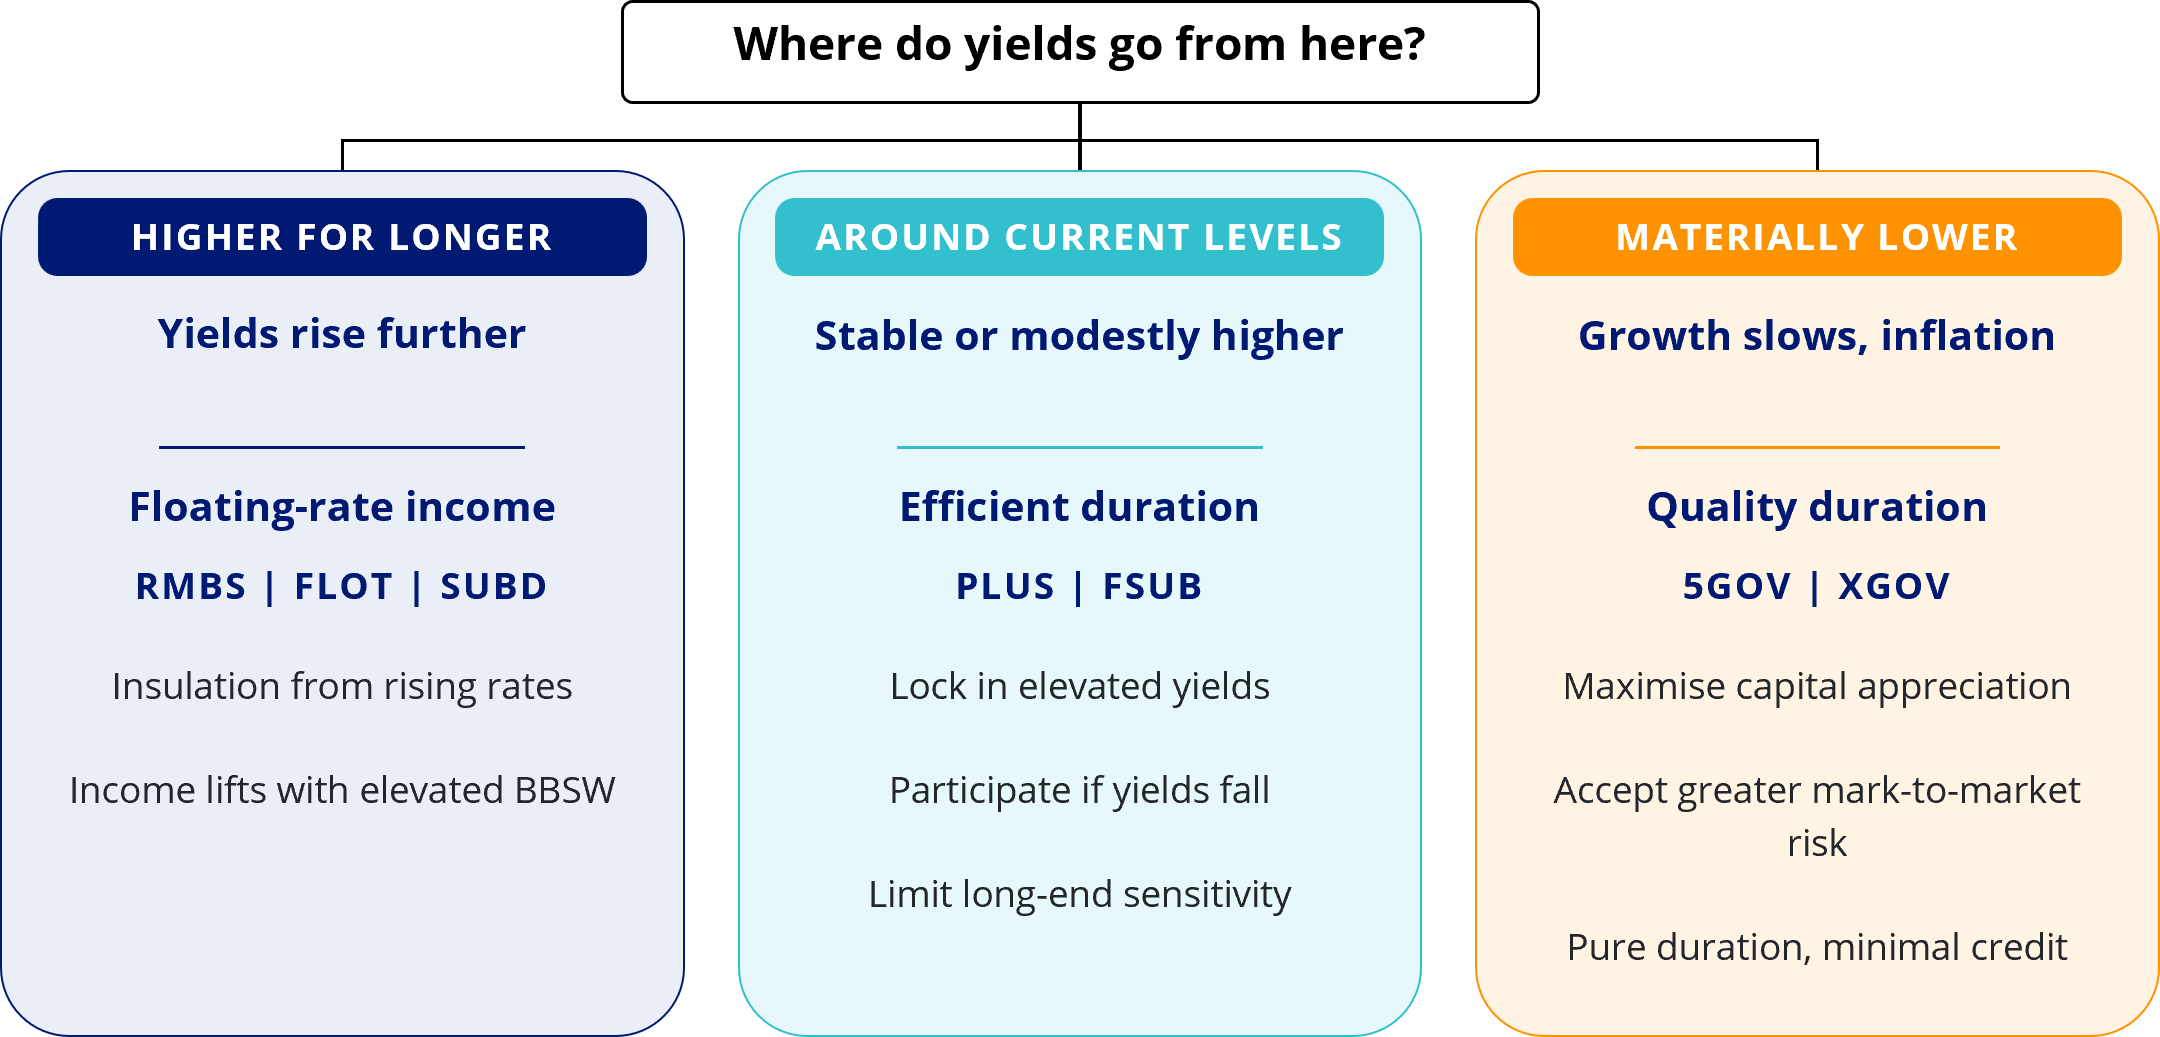
1. Higher for Longer: Prioritise Floating-Rate Income
This scenario assumes inflation remains persistent and the RBA keeps the cash rate higher for longer. Front-end rates stay elevated while longer-dated yields remain under pressure or move higher.
The objective in this environment is to preserve income while limiting sensitivity to upward movements in government bond yields. An upward movement in yields correlates to a decline in bond values. Floating-rate securities reset their coupons as interest rates change, allowing investors to benefit from elevated benchmark interest rates with limited interest-rate duration through increased payouts
Australian residential mortgage backed securities are a compelling way to access this opportunity, given the combination of elevated spreads, minimal interest rate duration and strong structural protection.
Relative value: VanEck Australian RMBS ETF (RMBS) currently offers a competitive level of income while carrying an AAA credit rating, the highest available from credit-rating agencies. This yield has also been more stable over time, supporting a more consistent income profile.
Chart 4: AUD AAA RMBS Index vs Bloomberg AusBond Credit FRN Index Yield to Worst
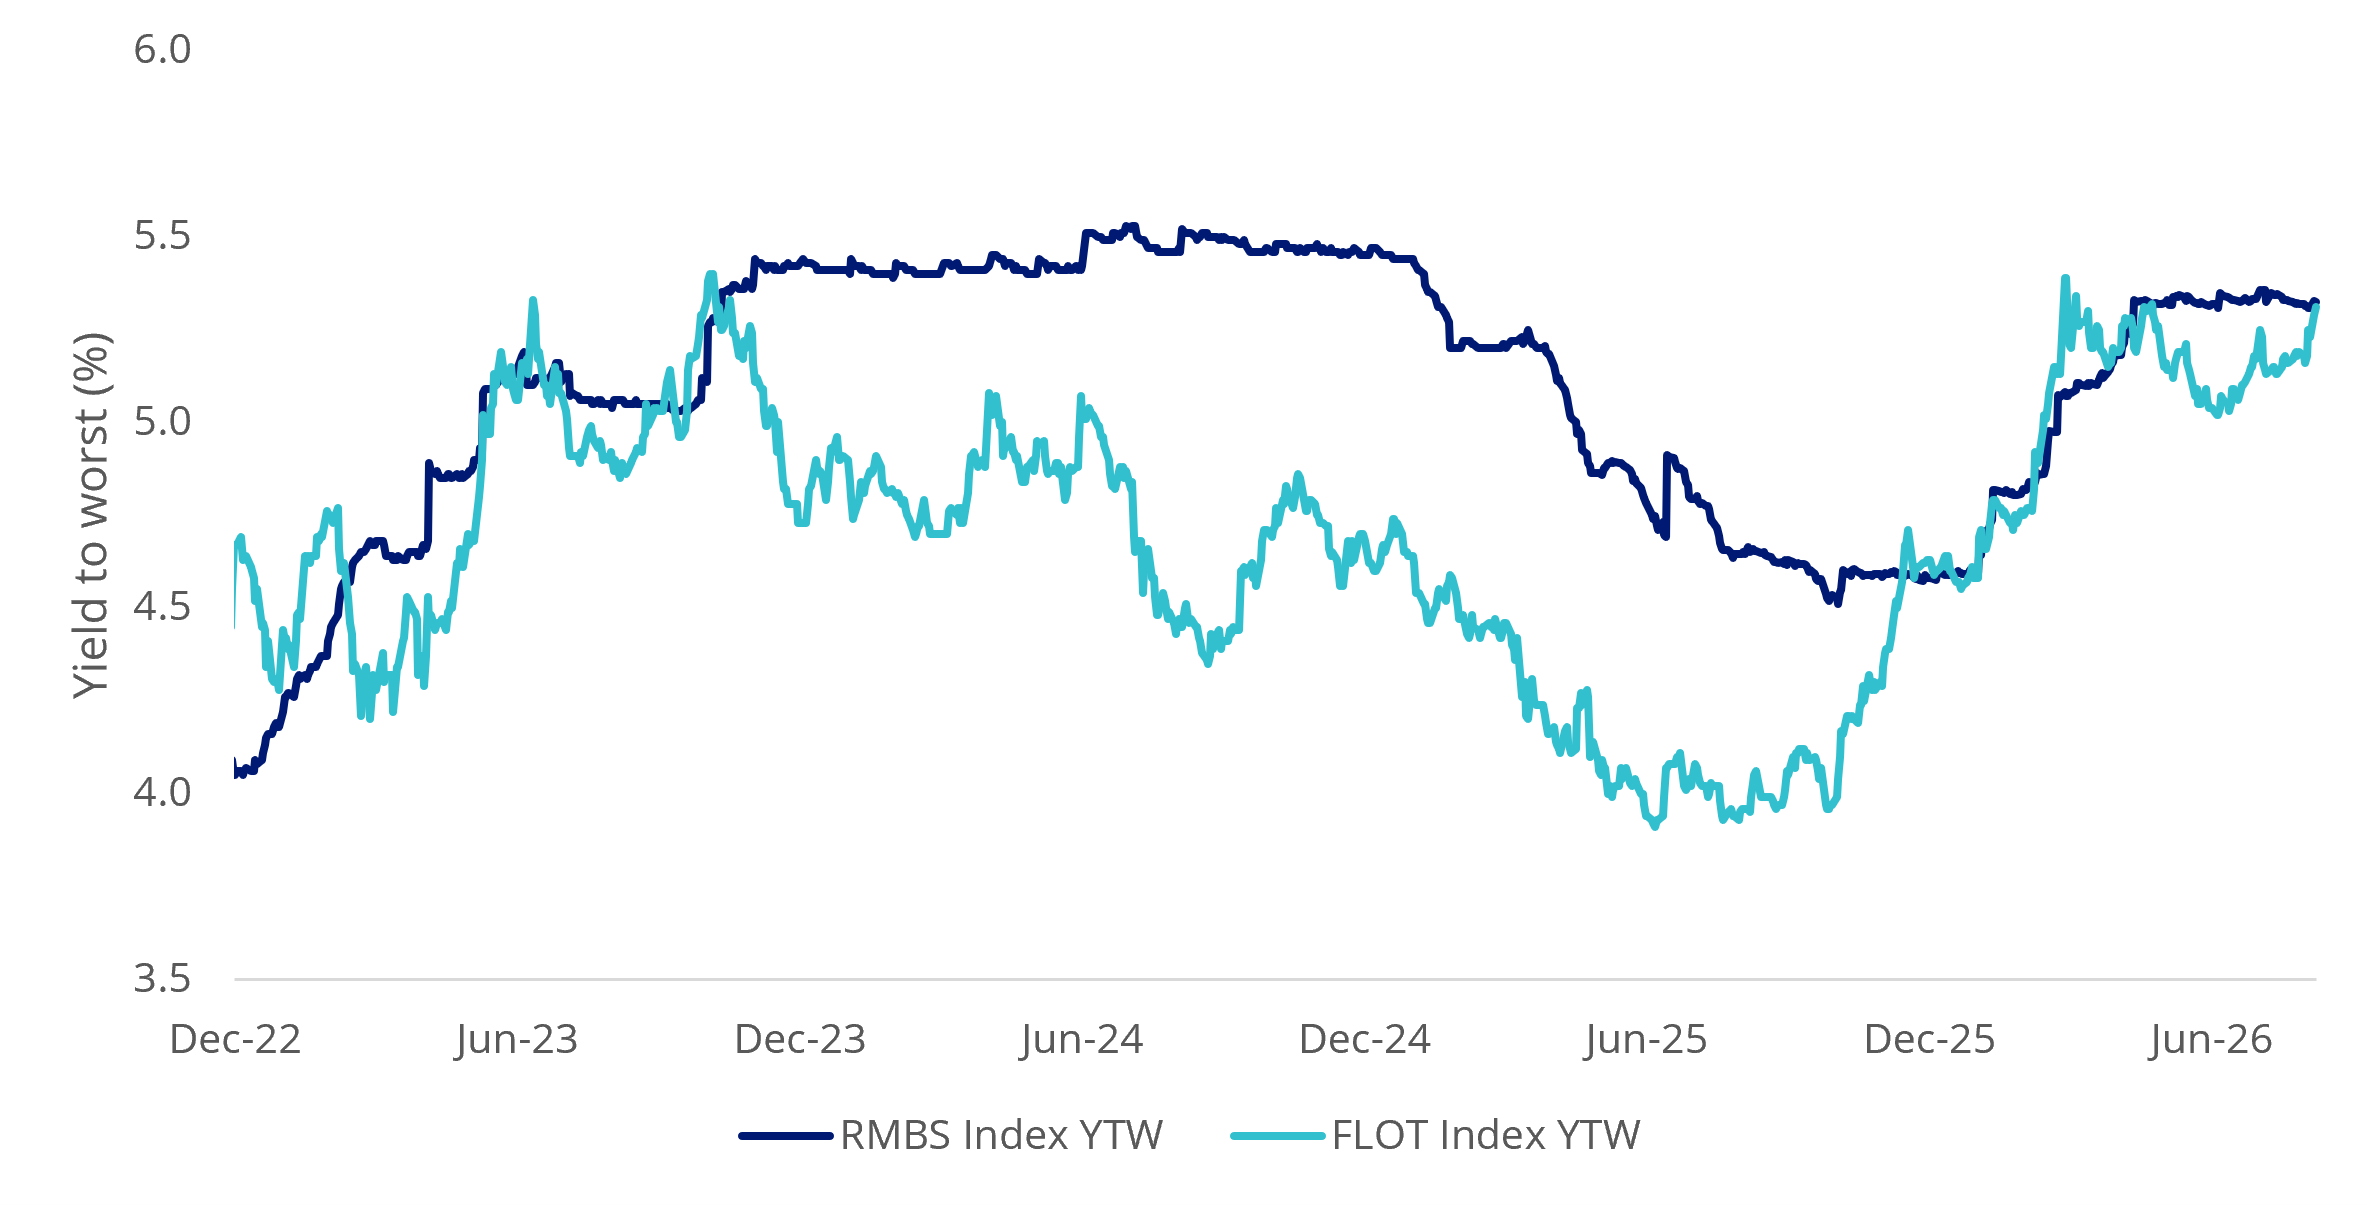
Source: Bloomberg, ICE. RMBS Index is the ICE 0.5-3 Year AAA Large Cap Australian RMBS Index. FLOT Index is the Bloomberg AusBond Credit FRN 0+ Yr Index. Yield to Worst is a measure of the lowest possible yield that can be received assuming the security does not default. YTW does not account for fees or taxes. YTW is not a forecast, and is not a guarantee of, the future return of the fund.
Rate insulation: RMBS is a floating-rate exposure, meaning returns are driven primarily by income and credit spreads rather than movements in government bond yields.
Structural protection: The senior position of AAA-rated RMBS within the capital structure provides substantial protection against credit losses. A material deterioration in both housing values and borrower performance would be required before the AAA tranche is impaired.
The table below illustrates the severity of stress required before capital losses reach the AAA level. Historically, Australian RMBS has not experienced conditions approaching this magnitude.
Table 1: RMBS ETF Capital Loss Heatmap
| Default Rate | ||||||||||||
|---|---|---|---|---|---|---|---|---|---|---|---|---|
| 0% | 10% | 20% | 30% | 40% | 50% | 60% | 70% | 80% | 90% | 100% | ||
| House Price Decline | 0% | · | · | · | · | · | · | · | · | · | · | · |
| -10% | · | · | · | · | · | · | · | · | · | · | · | |
| -20% | · | · | · | · | · | · | · | · | · | · | · | |
| -30% | · | · | · | · | · | · | · | · | · | · | · | |
| -40% | · | · | · | · | · | · | · | · | · | · | 2% | |
| -50% | · | · | · | · | · | · | 3% | 7% | 12% | 16% | 21% | |
| -60% | · | · | · | · | 2% | 8% | 14% | 21% | 27% | 33% | 39% | |
| -70% | · | · | · | 1% | 9% | 17% | 26% | 34% | 42% | 50% | 58% | |
| -80% | · | · | · | 7% | 17% | 27% | 37% | 47% | 57% | 67% | 77% | |
| -90% | · | · | 1% | 12% | 24% | 36% | 48% | 60% | 72% | 84% | 96% | |
| -100% | · | · | 4% | 18% | 32% | 46% | 59% | 73% | 87% | 100% | 100% | |
| Legend: | No capital loss | Partial capital loss | Full capital loss |
|---|
Source: Bloomberg, VanEck proprietary model. Modelling based on underlying mortgage LVR 59.9%, WAC 6.86%, credit enhancement 18.65%. Per-loan loss given default modelled as LGD = max(0, (1 + WAC × t) − (1 + h)(1 − f) / LTV), where t = 1.5-year recovery period, h = house price change, f = 10% foreclosure and sale costs. Pool loss = default rate × LGD. Tranche capital loss = min(1, max(0, pool loss − CE) / tranche thickness), thickness set at 80.0%. Assumes CE is the sole loss absorber; excess spread, LMI, and turbo/sequential-pay waterfall dynamics are excluded. Results are illustrative stress outcomes, not forecasts.
Portfolio quality: The average outstanding loan represented 59.9% of the property’s value, leaving borrowers with a substantial equity buffer. Only 0.53% of loans were at least 90 days behind on repayments, suggesting mortgage stress within the portfolio has remained low despite elevated interest rates. These metrics remain resilient despite the RBA’s restrictive policy setting.
For investors seeking simpler floating-rate exposure without securitisation or structural complexity, the VanEck Australian Floating Rate ETF (FLOT) provides a diversified portfolio of high-quality senior credit with limited duration risk. Meanwhile, the VanEck Australian Subordinated Debt ETF (SUBD) offers a higher yield than floating rate securities while remaining investment grade, implying higher credit quality and lower risk of total loss of capital.
2. Yields remain elevated: favour efficient duration
This scenario assumes current yields are attractive, but the path lower remains uncertain. Restrictive interest rate policy may begin to weigh on growth, although inflation remains too elevated for a meaningful decline in bond yields in the near term. Under this outcome, yields could remain around current levels or rise modestly before normalising over time.
For investors with this view, the opportunity is to lock in yields while they are trading at multi-year highs while retaining upside should rates fall. The challenge, however, is to avoid taking unnecessary duration risk while yields remain volatile. This favours the belly of the curve, where investors can capture attractive income and still benefit from a decline in yields without taking the larger price swings associated with longer-dated bonds.
Chart 5: Australian Government Bond Yield Change Dispersion (10-Year Trailing)
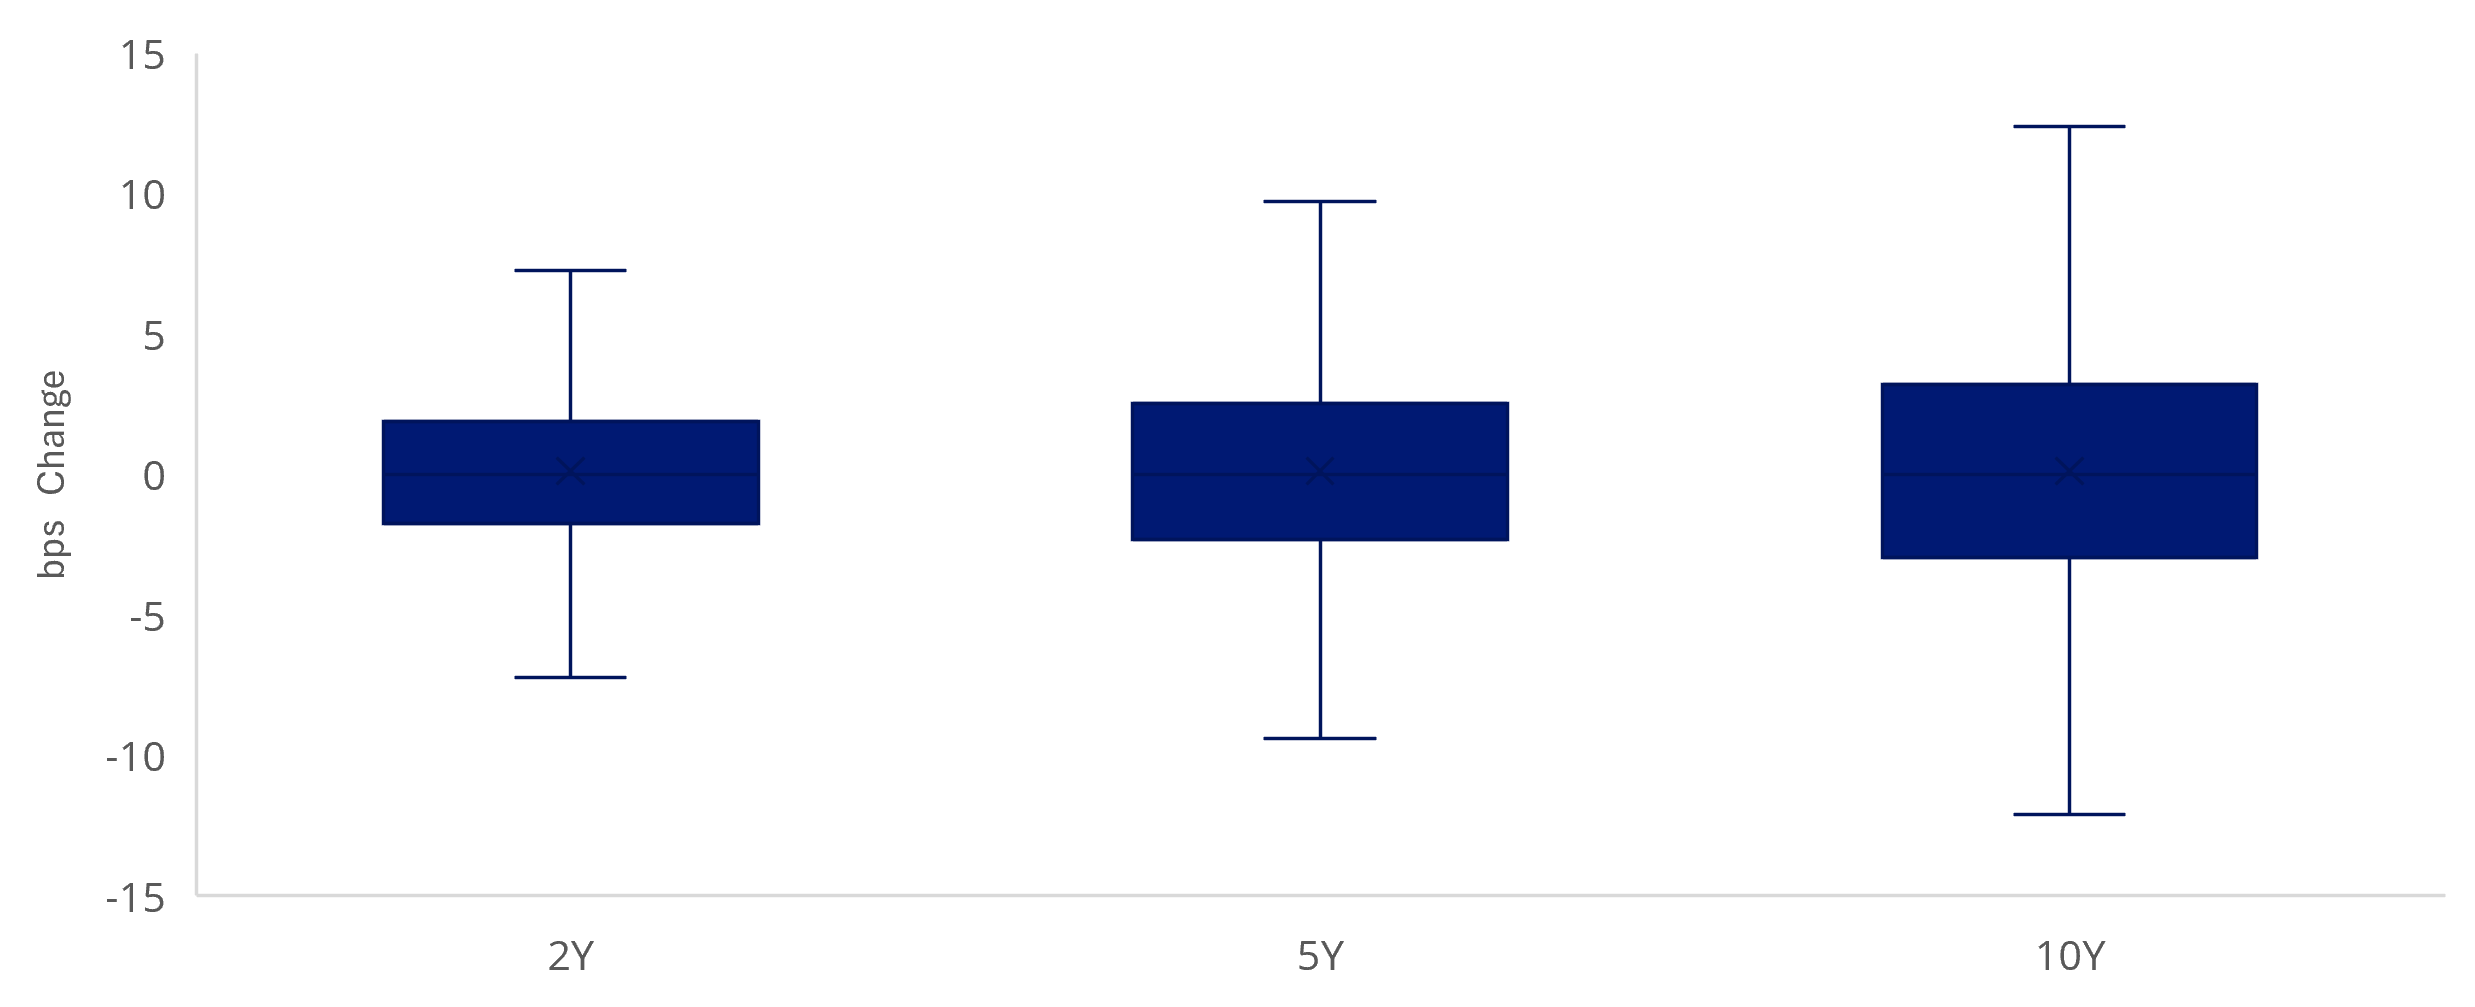
Source: Bloomberg. As at 1 September 2026.
The case for this positioning is supported by four factors:
Income buffer: Higher starting yields provide more income to offset modest mark-to-market losses if yields rise.
Meaningful upside: Around 5 years of duration still provides capital appreciation if yields fall.
Controlled sensitivity: The belly limits exposure to the larger price swings seen in long-duration bonds.
Better timing tolerance: Returns rely less on identifying the exact peak in the rate cycle.
We think the VanEck Australian Fixed Rate Subordinated Debt ETF (FSUB) and the VanEck Australian Corporate Bond Plus ETF (PLUS) are attractive options in this environment. Relative to their sensitivity to interest-rate movements, we think investors are being adequately rewarded via the yields and where they are currently at. This provides an efficient balance between income and interest-rate sensitivity, with attractive starting yields and meaningful upside if rates fall while avoiding the higher volatility associated with longer-duration exposures.
This yield efficiency is particularly attractive given the government’s proposed changes to capital gains taxation. If the after-tax appeal of capital-gains-led strategies is reduced, the case for generating a larger share of returns through income becomes stronger. At current yield levels, fixed income offers a more competitive income profile without requiring the same reliance on capital appreciation.
3. Yields move materially lower: maximise duration
This scenario assumes inflation moderates and economic growth weakens faster than expected, prompting the RBA to move toward an interest rate cutting cycle. In this environment, long-dated government bond yields would be expected to fall materially.
Long-duration government bonds provide the clearest expression of this view. Their returns are influenced mainly by changes in interest rates, with considerably less credit risk than corporate bonds.
We calculate that the longer-duration VanEck 10+ Year Australian Government Bond ETF (XGOV), if yields fell 1% may gain approximately 13%, after allowing for income and fees.
This gives investors greater potential to benefit if interest rates fall, as longer-dated bonds generally rise in value. The reverse is also true: they are likely to fall further if rates rise. The following table below shows how changes in bond yields may affect our different fixed income ETFs, with the caveat that these are estimations only and that a yield curve move is never caused by a single factor.
| As at 1 September 2026 | Estimated 12 month return - yield change1after fees | ||||||
|---|---|---|---|---|---|---|---|
| -1% chg | -0.5% chg | -0.25% chg | 0% chg | 0.25% chg | 0.5% chg | 1% chg | |
| Aus Gov 1-5yrs | 6.32 | 5.43 | 4.98 | 4.53 | 4.09 | 3.64 | 2.75 |
| Aus Gov 5-10yrs | 10.18 | 7.54 | 6.22 | 4.90 | 3.58 | 2.26 | -0.38 |
| Aus Gov 10-20yrs | 13.15 | 9.23 | 7.27 | 5.30 | 3.34 | 1.38 | -2.55 |
| PLUS | 8.99 | 7.30 | 6.46 | 5.61 | 4.77 | 3.92 | 2.23 |
| FSUB | 9.06 | 7.45 | 6.64 | 5.83 | 5.02 | 4.22 | 2.60 |
1Estimated 12 month return = current YTM + yield change – duration * yield change – annual management fee. These are estimations only based on available data. Not a recommendation to act. Estimated returns are based on various assumptions about the future and are not indicative of fund or yield performance and cannot be guaranteed. Aus Gov 1-5yrs is VanEck 1-5 Year Australian Government Bond ETF, Aus Gov 5-10yrs is VanEck 5-10 Year Australian Government Bond ETF, Aus Gov 10-20yrs is VanEck 10+ Year Australian Government Bond ETF.
Australian bond yields are now at levels rarely seen over the past decade, creating an exciting opportunity for income investors. For those concerned that rates remain higher for longer, floating-rate credit can provide attractive income with limited interest-rate sensitivity. For investors expecting yields to stabilise, medium-duration bonds offer a balance of income and potential capital appreciation. If growth weakens and yields fall more materially, longer-duration government bonds provide greater upside.
Across each scenario, elevated starting yields provide investors with more income today and greater flexibility in how they position for the path ahead.
Key risks
Investments in these funds carry risks associated with bond markets generally, interest rate movements, issuer or borrower default, credit ratings, fund operations, liquidity and tracking an index. See the respective PDSs and TMDs for details.


Published: 10 September 2026
Any views expressed are opinions of the author at the time of writing and is not a recommendation to act.
VanEck Investments Limited (ACN 146 596 116 AFSL 416755) (VanEck) is the issuer and responsible entity of all VanEck exchange traded funds (Funds) trading on the ASX. This information is general in nature and not personal advice, it does not take into account any person’s financial objectives, situation or needs. You should consider whether or not an investment in any Fund is appropriate for you. Investments in a Fund involve risks associated with financial markets. These risks vary depending on a Fund’s investment objective. Refer to the applicable product disclosure statement (PDS) and target market determination (TMD) available at vaneck.com.au for more details. Investment returns and capital are not guaranteed.