RBA: 4 and not done?


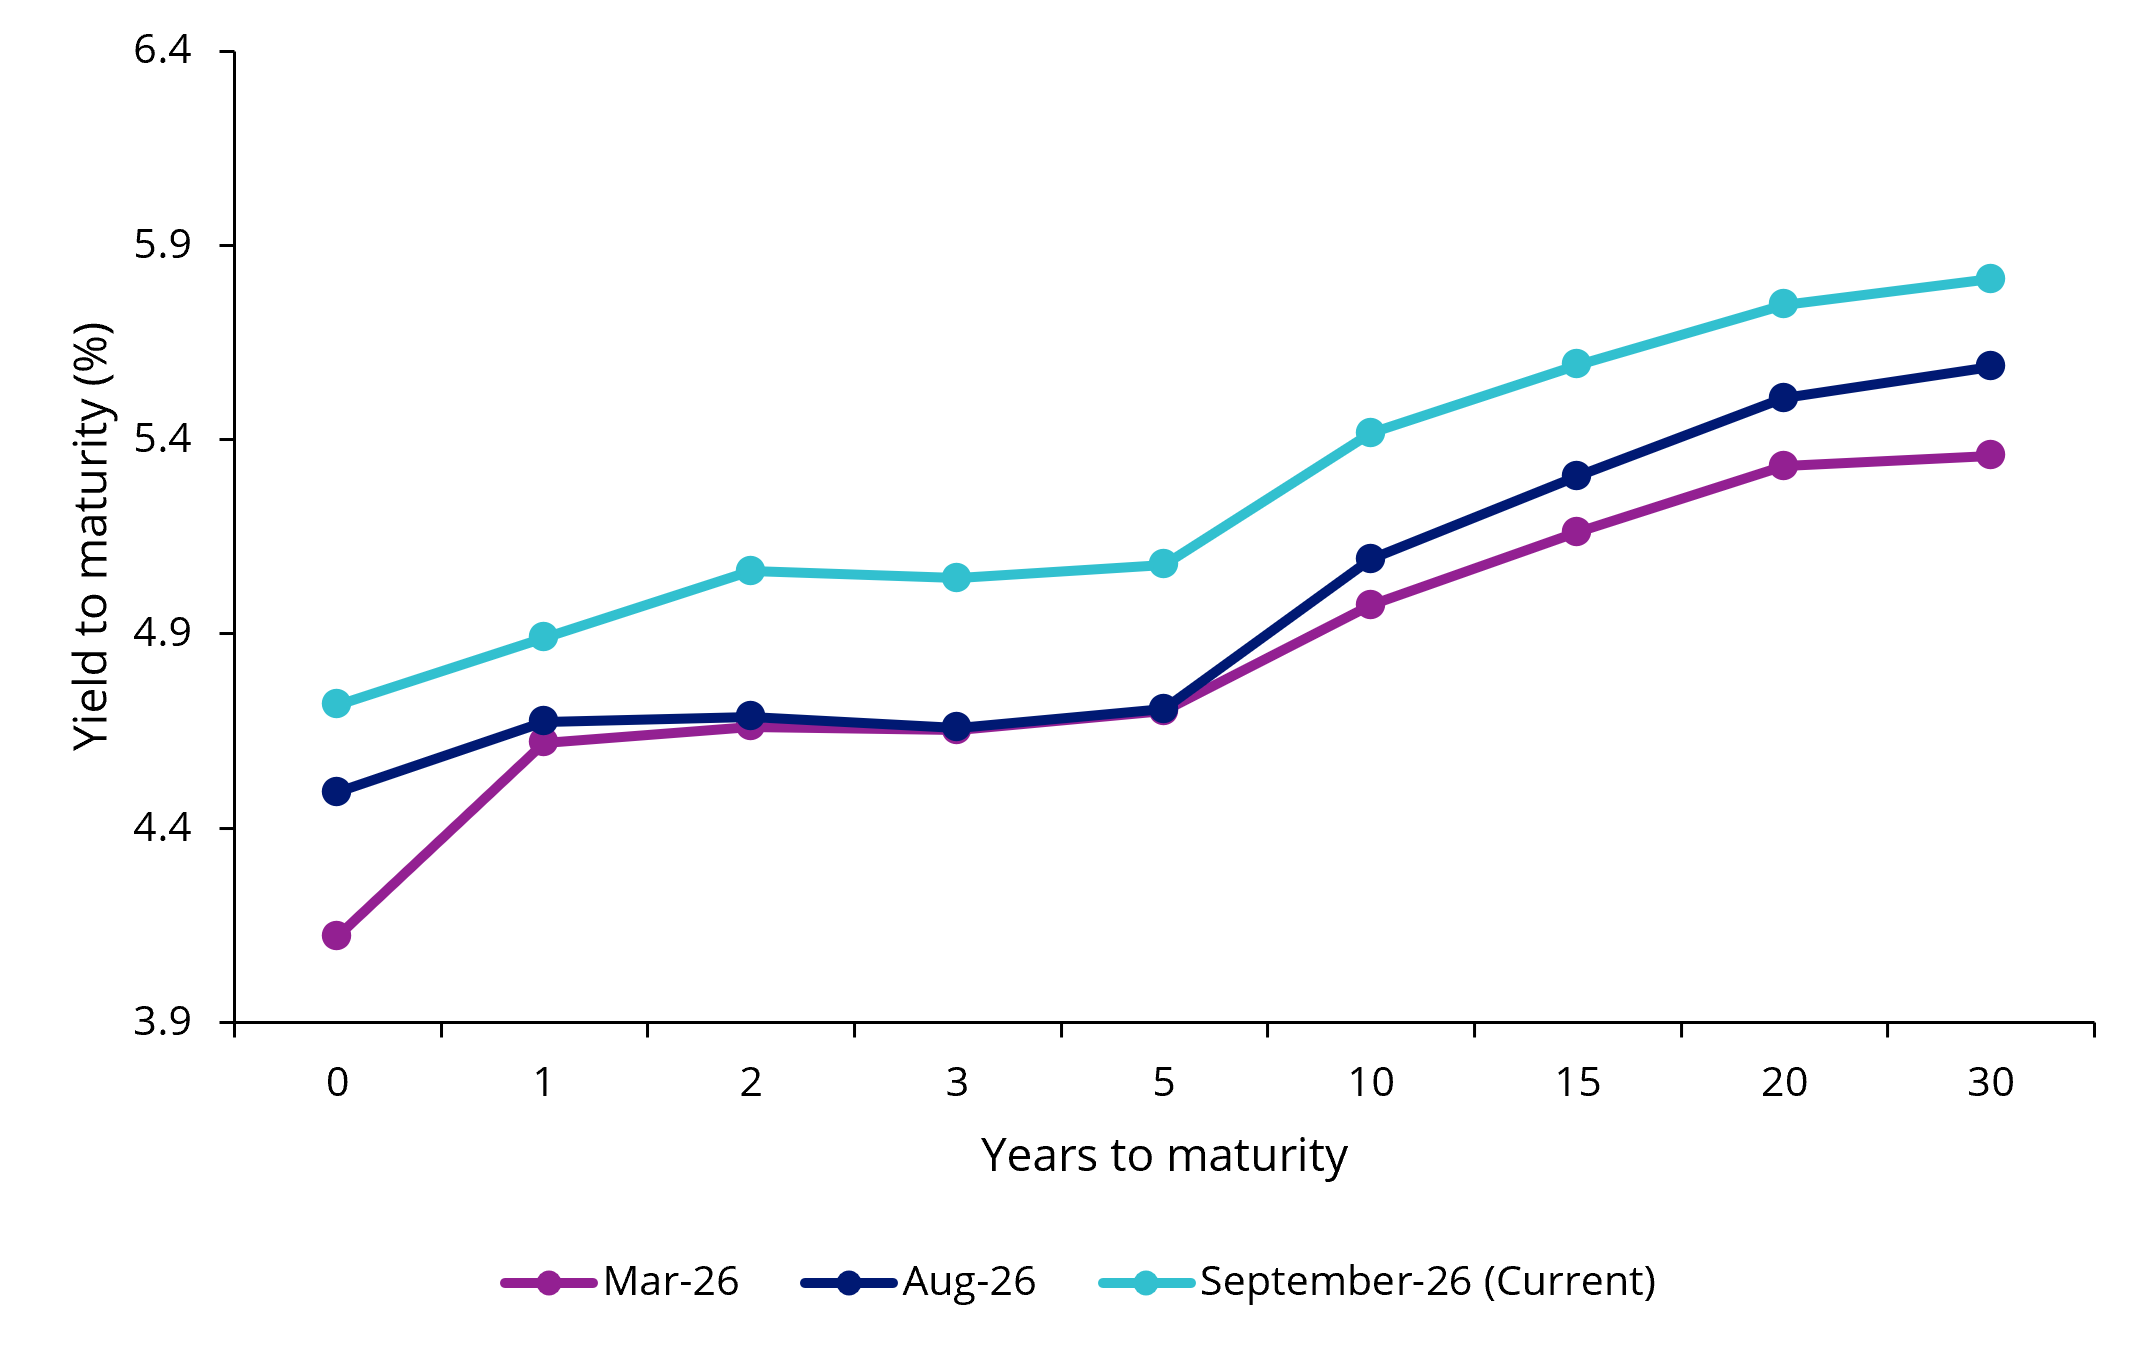
Over the past nine months, the most significant moves in Australian financial markets have been taking place in the bond market. As the chart below shows, yields across the curve have ratcheted up.
Chart 1: The Australian Government bond yield curve
Source: Bloomberg, as at 29 September 2026
The chart also shows how the sharp leg up has affected both the short and long end, in line with a series of cash rate hikes from the RBA. For the first time since 2011, investing in an Australian government bond with a three-year maturity can net you a 5% nominal yield.
In recent weeks, RBA officials have made the reason for this move very clear. Trimmed mean inflation, the metric that the RBA looks at most closely, remains well above its 2-3% target range. It has been above this range since July 2025, with electricity, housing, food and services inflation among the key drivers.
We have been calling for this rate hike for some time and continue to argue that another rate hike is plausible this calendar year.
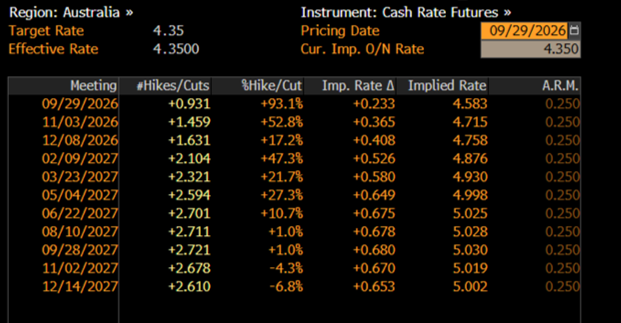
With the RBA hiking today and markets pricing in a greater than 50-50 chance of another hike on Melbourne Cup day, the cash rate is likely to remain elevated for longer than previously anticipated.
Table 1: Rates markets are pricing in more moves from the RBA
Source: Bloomberg, as at 29 September 2026
In this environment, we think floating rate notes and bonds are offering their most compelling opportunity in years. Due to coupon resets with movements in the cash rate, investors capture elevated income with little to no duration risk. Should inflation continue to rise or surprise to the upside, we think any upward adjustment in yields would have a limited impact on capital values given the inherent short-duration nature of these securities.
In fact, the average yield to maturity on FLOT (5.58%, as at 28 September 2026) is the highest it has been since the product listed in July 2017.
VanEck short duration and floating rate exposures
| As at 28 September 2026 | Australian Floating Rate ETF (FLOT) |
Australian RMBS ETF (RMBS) | VanEck Cash Plus Active ETF (MONY) |
| Number of constituents | 247 | 106 | 53 |
| Ave Modified Duration (yrs) | 0.13 | 0.05 | 0.22 |
| Ave Yield to Maturity/Worst | 5.58% | 5.29%* | 5.11%* |
| Ave Running Yield^ | 5.28% | -- | -- |
| Ave Credit Rating1 | AA- | AAA | AA- |
| Average time to Maturity (yrs) | 2.38 | 2.102 | 0.20 |
| Top Holding Weight | 1.73% | 8.05% | 4.39% |
*yield to worst; ^yield measures are not a reliable indicator of future dividend income from the funds,1Average credit rating is calculated taking the weighted average Bloomberg composite bond rating. If a bond issued by a national government is unrated, the Bloomberg issuer composite rating will be used. If no rating is available, the security will be not rated and excluded from the calculation.2Weighted average life (WAL).
Longer-dated portfolio defence
Australian 10-year bond yields have eclipsed 5.4%, as of writing. The move reflects stubborn inflation, uncertainty around tit-for-tat Middle East tensions and the recent stronger-than-expected Australian GDP print.
As yields rise, bond prices fall, meaning valuations are now more attractive than they have been in years. If economic conditions soften (e.g. inflation comes in lower than expected or unemployment increases), yields could move lower. This would likely drive bond prices higher and reward those invested in longer-dated bonds.
We think the current yields provide a compelling entry point for duration-focused strategies, as well as another opportunity for those who have been averaging in their fixed income exposure given it is very difficult to time the exact top of the rates curve.
VanEck longer-dated exposures
| As at 28 September 2026 | Australian Corporate Bond Plus ETF (PLUS) |
Australian Fixed Rate Subordinated Debt ETF (FSUB) | 5-10 Year Australian Government Bond ETF (5GOV) | 10+ Year Australian Government Bond ETF (XGOV) |
| Number of constituents | 196 | 49 | 54 | 38 |
| Average modified duration (yrs) | 4.58 | 4.15 | 6.24 | 8.73 |
| Average yield to maturity/worst | 6.32% | 6.47%* | 5.43% | 5.78% |
| Average running yield^ | 6.32% | 5.36% | 3.47% | 4.86% |
| Average credit rating profile1 | A- | A- | AAA | AA+ |
| Average time to maturity (yrs) | 5.66 | 10.27 | 7.31 | 11.63 |
| Top holding weight | 1.67% | 8.46% | 6.08% | 11.84% |
*yield to worst; ^yield measures are not a reliable indicator of future dividend income from the funds,1Average credit rating is calculated taking the weighted average Bloomberg composite bond rating. If a bond issued by a national government is unrated, the Bloomberg issuer composite rating will be used. If no rating is available, the security will be not rated and excluded from the calculation.
Key risks
An investment in the ETFs carry risks associated with: interest rate movements, bond markets generally, subordinated debt (SUBD and FSUB), issuer default, credit ratings, country and issuer concentration, liquidity, tracking an index and fund operations. See the PDS for more details.


Published: 29 September 2026