Why investors should “mind the GARP” in Australian small caps


Australian small companies have begun to outperform the S&P/ASX 200 as markets have tempered expectations that the RBA will tighten more than once more this cycle.
If the RBA cash rate is near or has reached its terminal level, Australian small companies may stand to benefit.
The macro environment is becoming more supportive
Australian equity portfolios remain heavily concentrated in large-cap companies, with the majority of capital allocated to the S&P/ASX 200. While these businesses form the core of the market, they represent only a fraction of Australia's listed companies and leave many portfolios underexposed to the broader opportunity set available across small caps.
For investors seeking genuine exposure to the Australian economy, breadth matters. Small companies provide access to businesses earlier in their growth journey, operating in sectors and industries that are often underrepresented in the large-cap universe. An allocation to small caps can therefore broaden portfolio diversification and introduce additional sources of earnings growth that may not be available through large-cap exposures alone.
Recent market conditions have also become more supportive. Australian small companies have outperformed the S&P/ASX 200 over recent months as investors have wound back expectations for further Reserve Bank tightening. While monetary policy remains restrictive, many investors are increasingly treating the current cash rate as close to, if not, the peak of the cycle.
Historically, Australian small companies have been among the most elastic to interest rate movements. This means that a downward shift in interest rate expectations may bode well for small caps.
Chart 1: Australia size relative performance
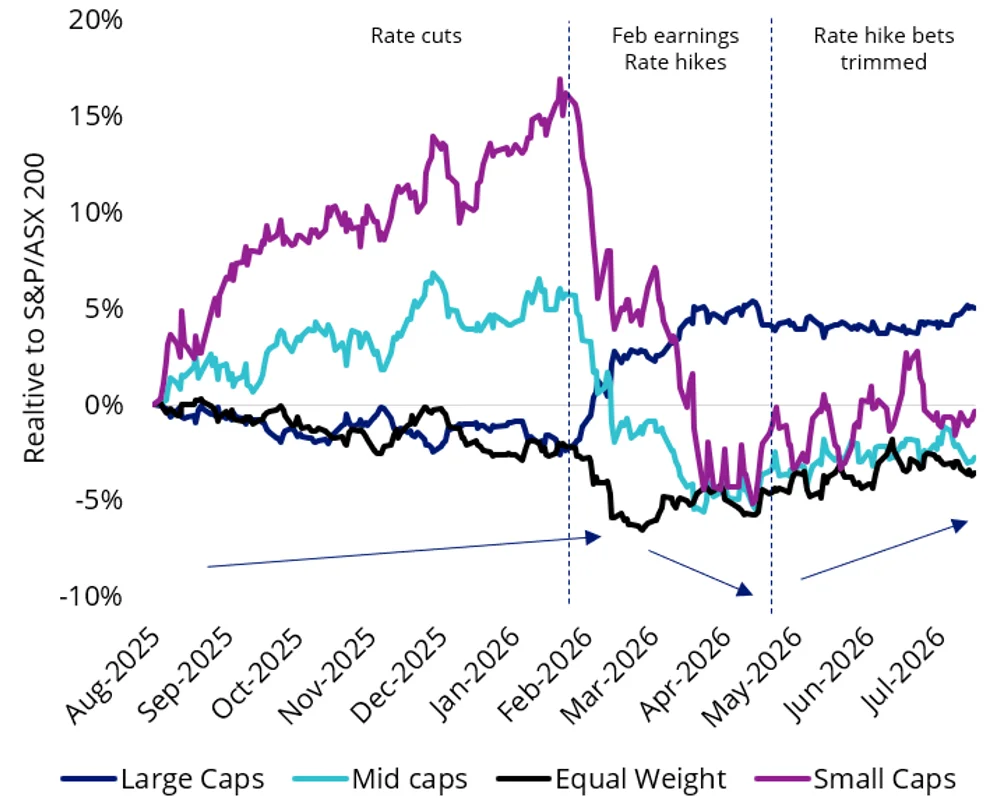
Source: As at 30 June 2026. Small Cap is ASX Small Ords Index. Mid Cap is ASX Mid 50 Index. Large Cap is ASX 20 Index. Equal weight is MVIS Australia Equal Weight Index. Performance in AUD. Past performance is not indicative of future performance. You cannot invest in an Index.
Why GARP matters today
Lower interest rate expectations are only part of the investment case. What makes today's environment particularly compelling is that Australian small companies continue to offer some of the strongest earnings growth prospects in the market, while still trading on reasonable valuations relative to other market segments.
As the charts below show, small caps are expected to deliver the highest earnings growth over the next two years despite trading on a forward earnings multiple that remains below large- and mid-cap peers.
Chart 2: Australian small caps offer superior EPS growth potential and less demanding valuations
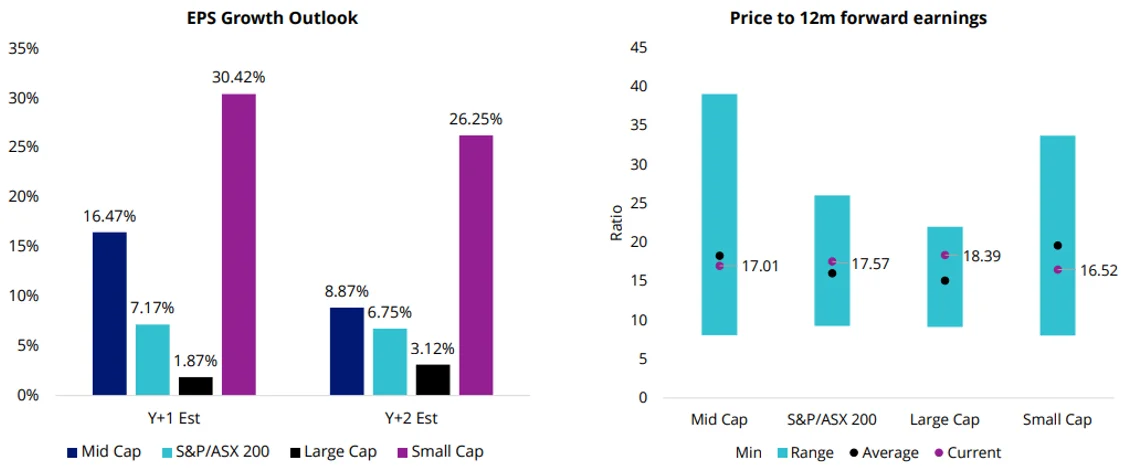
Source: FactSet. VanEck. Bloomberg. As at 30 June 2026. Large cap is S&P/ASX 20 Index. Mid cap is S&P/ASX Midcap 50 Index. Small Cap is S&P/ASX Small Ordinaries Index. Average is calculated as the 10 year historical average, using month end figures. These are estimates only. Past performance is not indicative of future performance.
Don’t just spray and pray
When capital was cheap, businesses with limited earnings or significant funding requirements could continue raising capital to support growth. As financing costs increased, investors shifted their focus to profitability, cash generation and balance sheet strength.
This is particularly relevant in Australian small companies, where a significant proportion of the investment universe remains unprofitable or reliant on external funding. Investing in a broad small-cap index fund means owning the entire market, including many of these businesses.
The chart below illustrates the impact of this approach. While the S&P/ASX Small Ordinaries Index currently allocates around 60% of its weight to companies with negative earnings, VanEck’s Australian Small Companies Masters ETF (MVS) reduces that exposure to just 8%.
Chart 3: MVS’ weight in companies with negative earnings vs Small Ordinaries Index
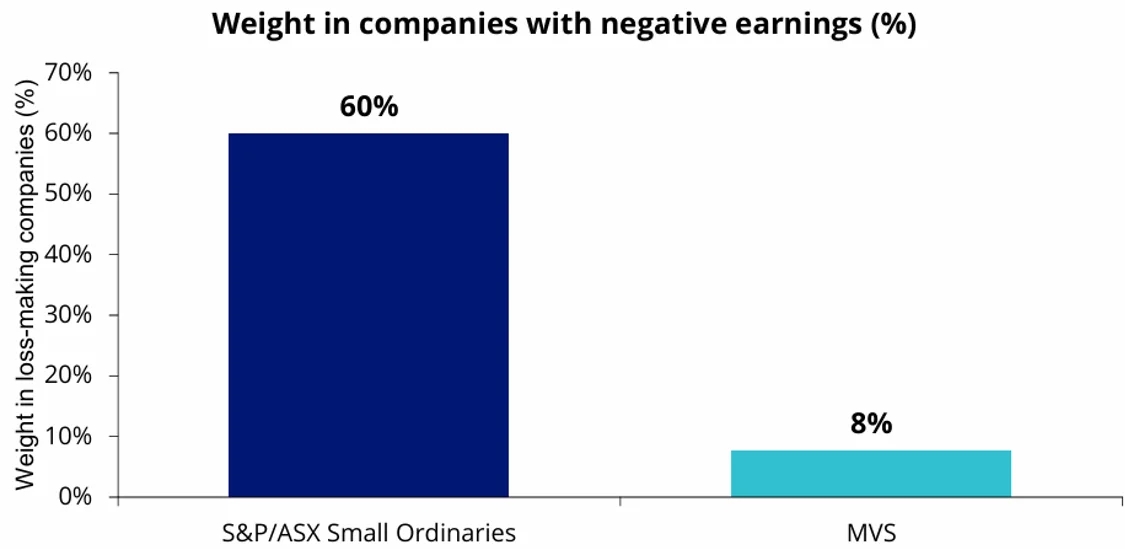
Source: VanEck, FactSet, as at 30 June 2026. Negative trailing Annual EPS, 98% coverage. This subject to change.
This is why a GARP approach becomes particularly relevant.
GARP seeks companies capable of delivering sustainable earnings growth without paying excessive valuations. In today's environment, that means businesses with strong balance sheets, consistent cash generation and attractive returns on capital. Small cap companies that fit this profile outperformed last year during the RBA’s short easing cycle.
The transition from cheap capital in 2021 to sharply higher interest rates in 2022 was a powerful reminder that not all growth is created equal. When capital was cheap and readily available, businesses with limited earnings could continue funding growth through debt and equity raisings. As interest rates rose sharply and financing conditions tightened, investors became far more selective.
Companies with strong balance sheets, consistent cash generation and attractive returns on capital generally proved more resilient as financing conditions tightened. This is precisely the type of company a GARP approach seeks to identify.
Why VanEck’s small cap strategy is overweight industrials
The current largest active overweight by sector in MVS is industrials.
Chart 4: MVS Index vs S&P/ASX Small Ordinaries Index sector weights
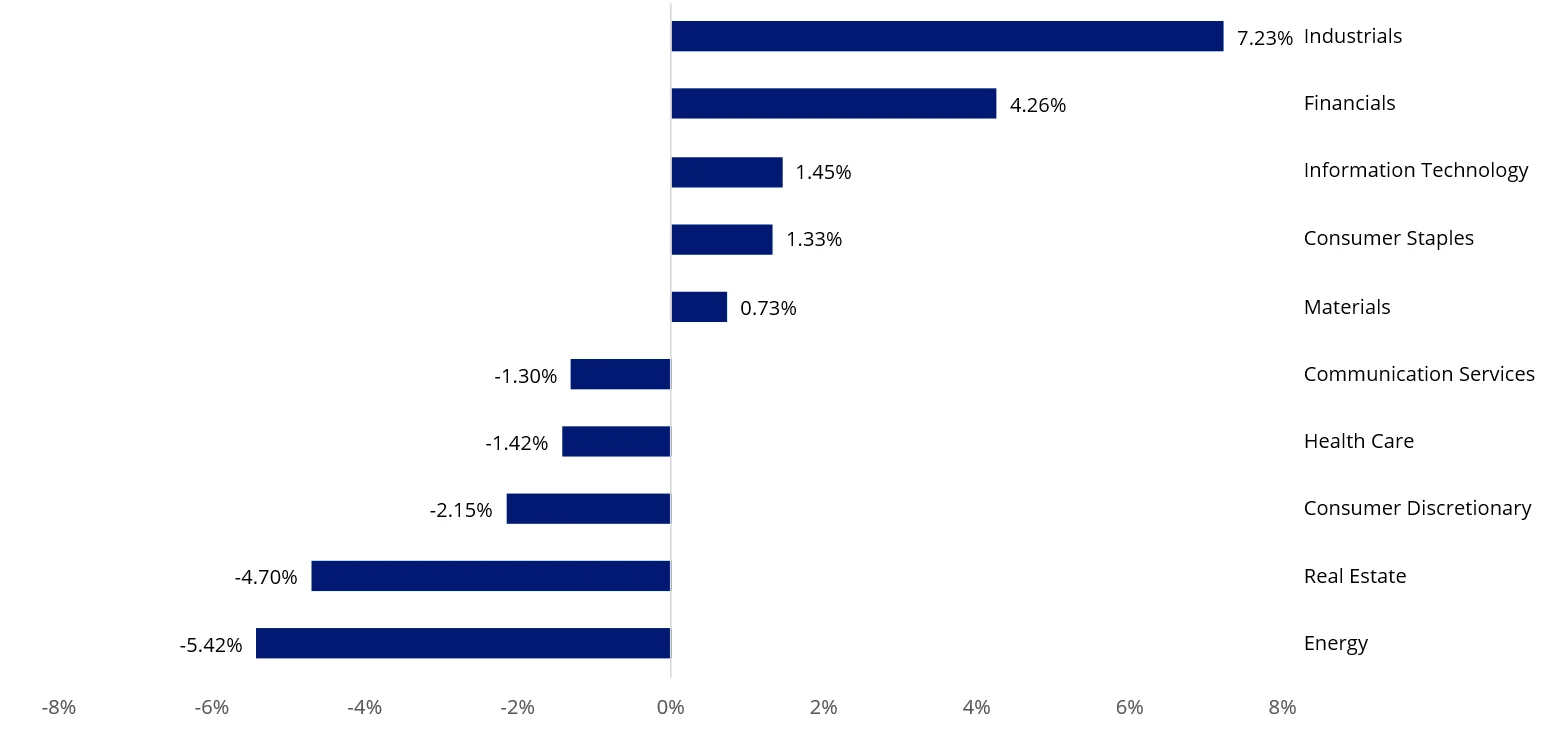
Source: VanEck, FactSet, as at 20 July 2026. You cannot invest directly in an index.
While industrial companies are often viewed as cyclical businesses, much of MVS' exposure is concentrated in specialist firms that support critical infrastructure across mining, utilities, transport and energy markets.
Rather than relying solely on new construction activity, these businesses derive a significant proportion of earnings from recurring maintenance and sustaining capital expenditure. Infrastructure owners cannot indefinitely defer maintaining essential assets, providing greater revenue visibility through the cycle.
Many also operate relatively light leverage business models, allowing them to generate attractive returns on equity without relying on elevated financial leverage.
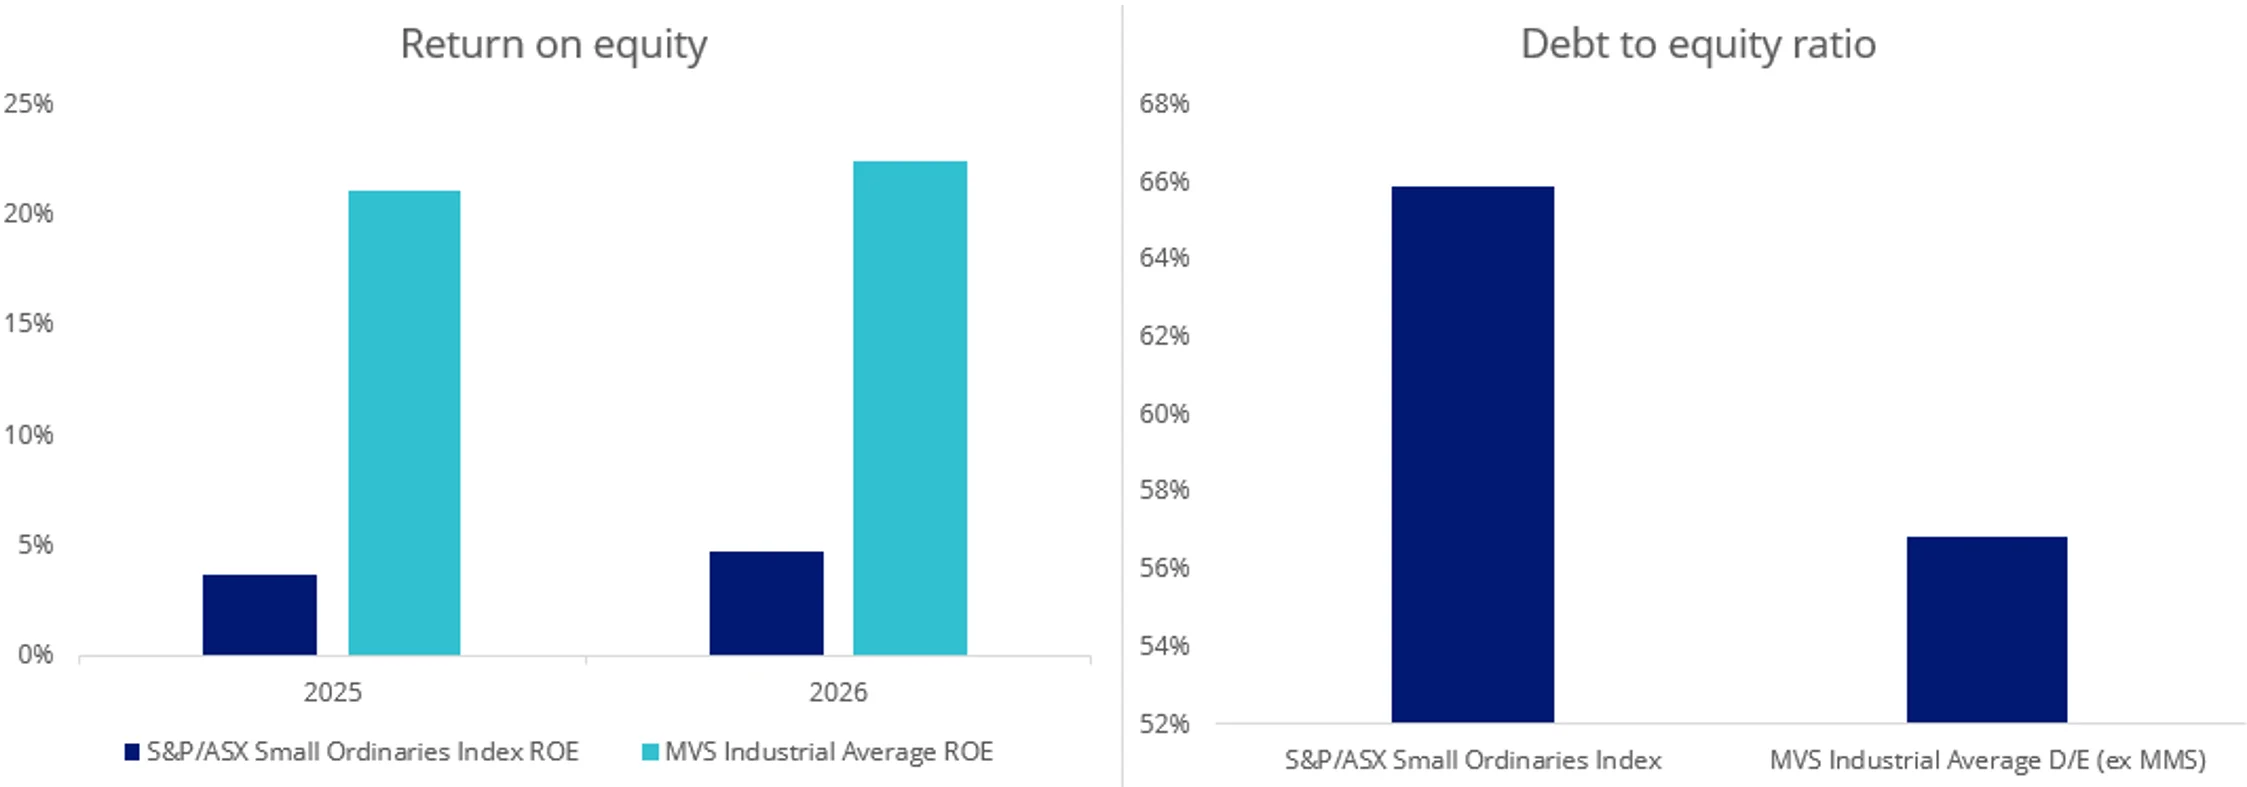
This is reflected in the portfolio's underlying fundamentals. As the chart below shows, MVS' industrial holdings have generated materially higher returns on equity than the broader Australian small-cap benchmark while maintaining lower debt-to-equity ratios.
Chart 5: Industrials with a GARP bent have generated higher ROE and lower debt to equity than the Small Ordinaries Index
Source: Bloomberg, as at 30 June 2026. Past performance is not an indicator of future performance. You cannot invest directly in an index.
Note that McMillan Shakespeare (ASX: MMS) was excluded from the industrial debt-to-equity chart because their business is an annuity generator, meaning their debt-to-equity ratio is significantly higher than the rest of the sector.
The process in action
Tasmea (ASX: TEA) and SRG Global (ASX: SRG) demonstrate the type of businesses identified by MVS’s methodology. Together, they contributed approximately two percentage points to the fund’s active outperformance over the past quarter.
Both provide essential maintenance, engineering and infrastructure services across mining, utilities, transport, energy and industrial markets. Around 80% of earnings come from recurring maintenance or sustaining expenditure, providing greater revenue visibility and reducing reliance on new construction activity.
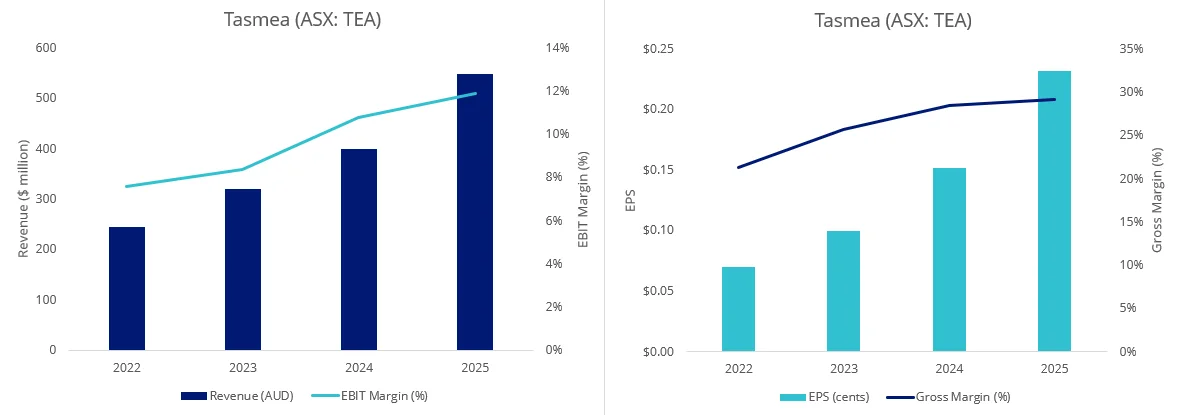
Tasmea’s revenues increased from approximately $245 million in FY2022 to $548 million in FY2025, while EBIT margins have expanded significantly in the last three years. This growth has been supported by repeat customers and increasing exposure to data centres, battery storage and energy services. Its more recent results also show strong revenue and operating cash-flow growth.
Chart 6: Tasmea’s performance over last four years
Source: Bloomberg, as at 30 June 2025. Past performance is not an indicator of future performance. Not a recommendation to act.
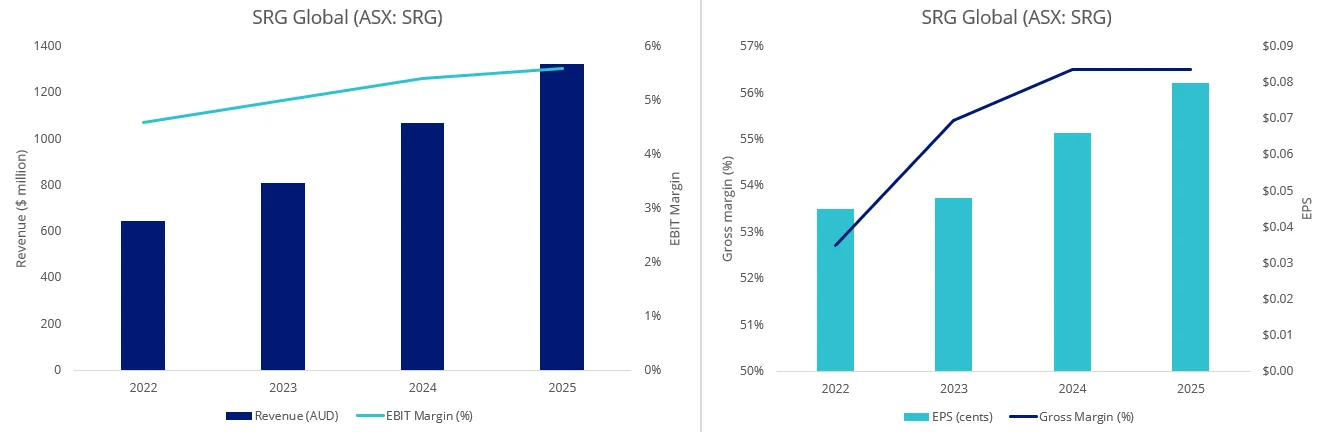
In FY2025, SRG Global’s EBITDA increased 29% and its EBIT rose 43%. Its $3.6 billion work-in-hand provides multi-year visibility across infrastructure, water, defence, transport and energy-transition markets. More recent figures also show continued double-digit revenue and operating-profit growth.
Chart 7: SRG Global’s performance over last four years
Source: Bloomberg, as at 30 June 2025. Past performance is not an indicator of future performance. Not a recommendation to act.
Importantly, both businesses have grown revenue without sacrificing operating profitability.
Resilient through higher rates
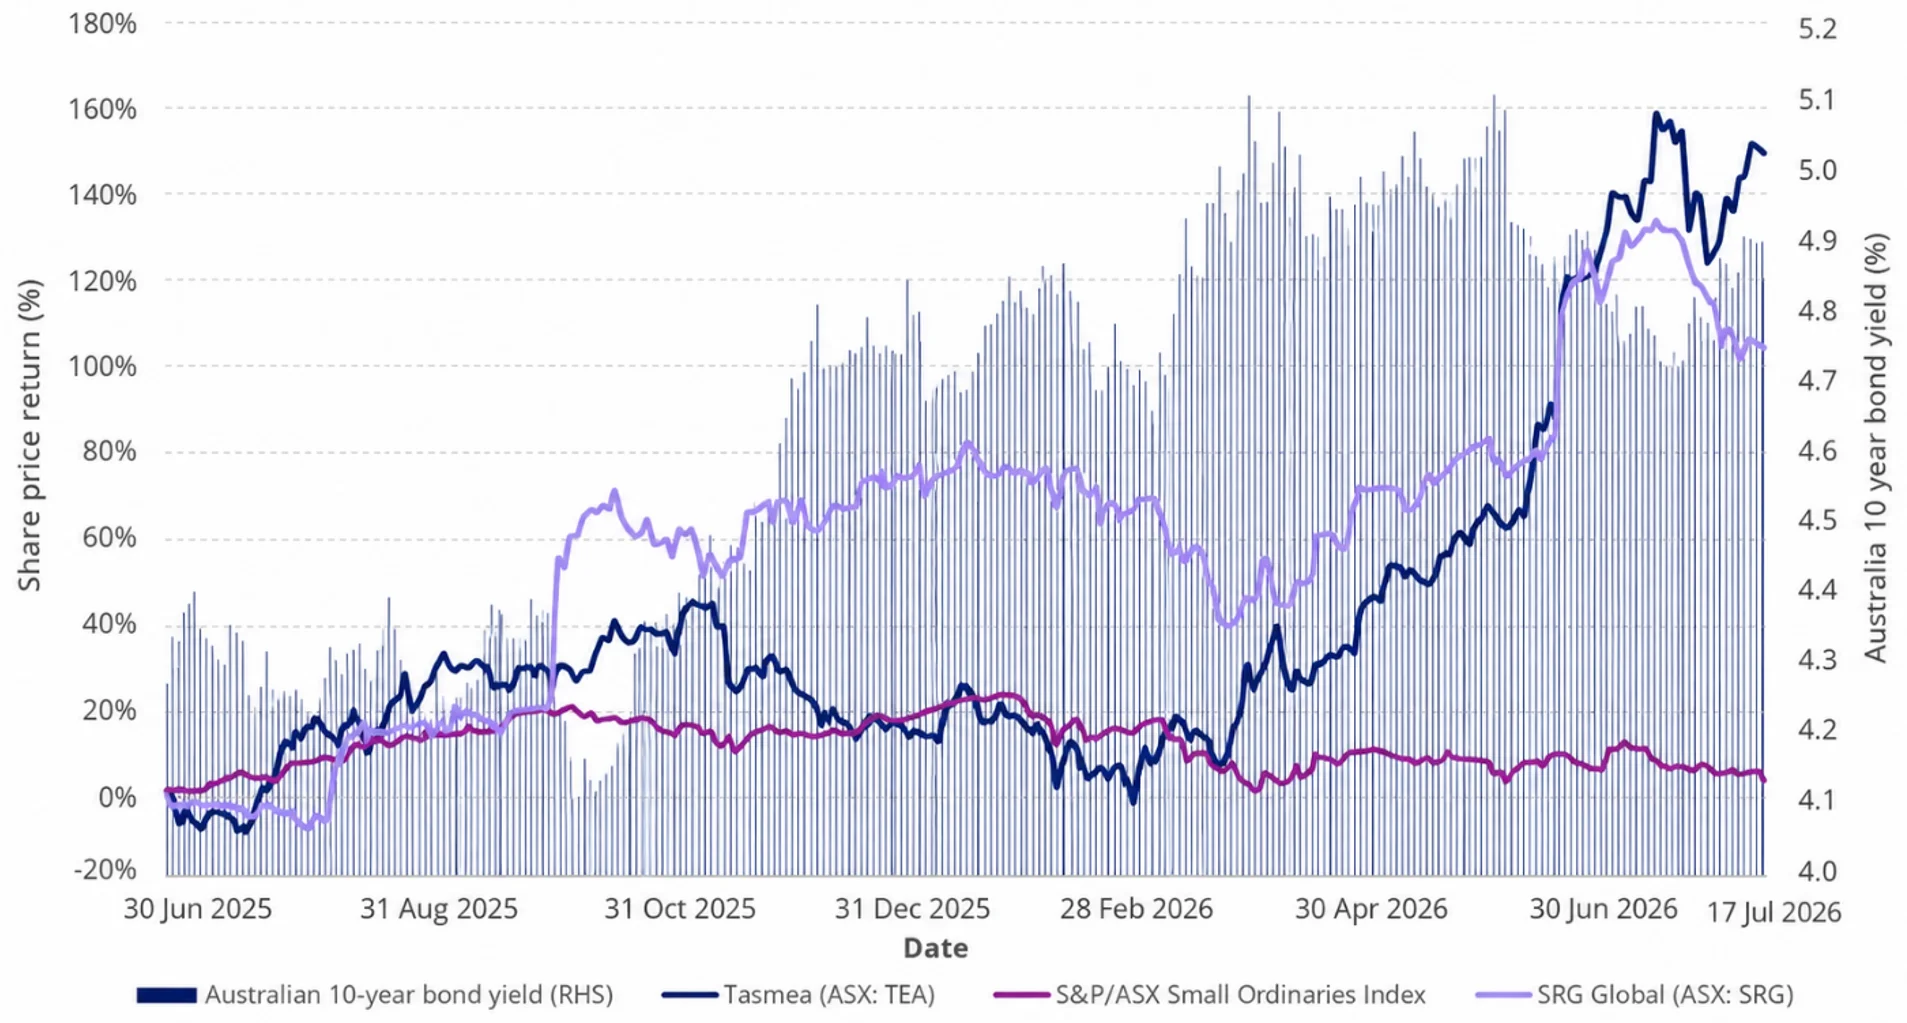
Despite the significant run up in Australian bond yields over the last 12 months, Tasmea and SRG Global materially outperformed the S&P/ASX Small Ordinaries Index. Both continued growing earnings and generating cash, demonstrating the value of recurring revenue, disciplined capital allocation and resilient operating models in a higher-rate environment.
Chart 8: SRG Global and Tasmea outperformed despite of rapidly rising bond yields
Source: Bloomberg, as at 17 July 2026. Past performance is not an indicator of future performance. You cannot invest directly in an index.
MVS’s industrials overweight reflects these qualities: stronger capital efficiency, lower leverage and exposure to essential services expenditure. Tasmea and SRG Global demonstrate why selectivity matters.
We believe when financing conditions tighten, businesses with resilient earnings, recurring revenues and disciplined capital allocation are often the ones best placed to outperform.
Key risks
An investment in the ETF carries risks associated with: financial markets generally, individual company management, industry sectors, stock and sector concentration, fund operations and tracking an index. See the VanEck Small Companies Masters ETF PDS and TMD for more details.
MVS is likely to be appropriate for a consumer who is seeking capital growth and a regular income distribution, is intending to use the product as a minor or satellite allocation within a portfolio, has an investment timeframe of at least 5 years, and has a high risk/return profile.


Published: 30 July 2026
IMPORTANT INFORMATION
VanEck Investments Limited (ACN 146 596 116 AFSL 416755) (VanEck) is the issuer and responsible entity of all VanEck exchange traded funds (Funds) trading on the ASX. This information is general in nature and not personal advice, it does not take into account any person’s financial objectives, situation or needs. The product disclosure statement (PDS) and the target market determination (TMD) for all Funds are available at vaneck.com.au. You should consider whether or not an investment in any Fund is appropriate for you. Investments in a Fund involve risks associated with financial markets. These risks vary depending on a Fund’s investment objective. Refer to the applicable PDS and TMD for more details on risks. Investment returns and capital are not guaranteed.