Sometimes it’s the little things


Small companies’ appeal for investors is easy to understand because smaller businesses often have more runway to expand, with the agility to adapt, pursue new opportunities and grow into new markets. But not every small company can turn that potential into sustained growth. This reporting season, we think, is highlighting the value of a prudent approach to investing in Australian small caps.
Australians love an underdog, even in investing. Most Australian portfolios have an allocation to small companies, reflecting not only their potential to grow and adapt as their businesses expand, but also a long-standing body of academic research supporting the small-cap premium. In 1981, academic and former vice-chairman of Pictet Asset Management Rolf Banz1found that “smaller firms (firms with low market capitalisation) have higher risk-adjusted returns than large firms on average”.
Small companies have long presented opportunities for growth and a persistent lack of research coverage. Australian investors may be familiar with the S&P/ASX Small Ordinaries Index (“Small Ords”) but information and analysis on many of the 200 companies in this index is not readily available. This means that many investment opportunities go unnoticed as small companies are often mispriced and, in Australia’s case, trade in an inefficient market.
But the problem for Australian investors is that, traditionally, to invest in Australian small companies it has been either:
- time consuming and risky for direct investors; or
- costly for indirect investors in actively managed small companies funds.
Last month, I wrote about how a selective GARP approach focuses on stronger businesses built to grow – you can read that analysis here.
GARP stands for Growth at a Reasonable Price. As the name suggests, it involves reviewing the growth potential of the company and then assessing a fair value to pay for owning it.
GARP analysis, long the domain of active managers, has been democratised through innovations in index design. Today, ETFs can track indices that have been created using many of the tools active managers use to assess companies. MarketGrader is one such company at the forefront of this innovation.
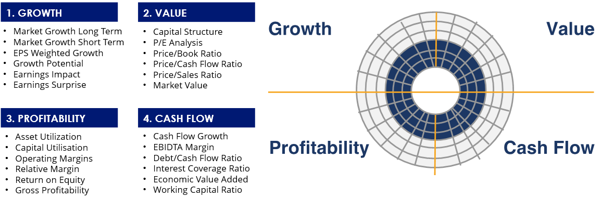
The MarketGrader Australia Small Cap 60 Index assesses all companies in the universe of Australian small companies and then grades all these based on 24 fundamental indicators across four analytical categories: growth, value, profitability and cash flow.
Chart 1: MarketGrader Research: A focus on fundamentals
Source: MarketGrader Research. For illustrative purposes only.
This is, in essence, a GARP analysis. The index includes securities that offer the best potential for ‘growth at a reasonable price’, grading securities from 0 to 100.
Companies with a score less than 40 (which would make them a ‘sell’) are excluded. The remaining small companies are then ranked by their earnings yield, targeting those trading at attractive valuations. The top 60 ranked companies are then selected for the fund.
The VanEck Small Companies Masters ETF (MVS) tracks the MarketGrader Australia Small Cap 60 Index.
This month’s reporting season has seen MVS’ GARP approach come to the fore.
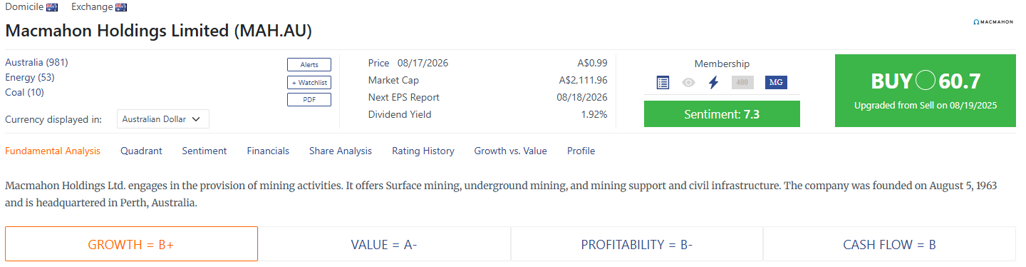
Macmahon Holdings Limited (ASX: MAH) is scored highly by MarketGrader and it rose 2.8% in the two days following its results.
Source: MarketGrader Research, 18 August 2026. Not a recommendation to act.
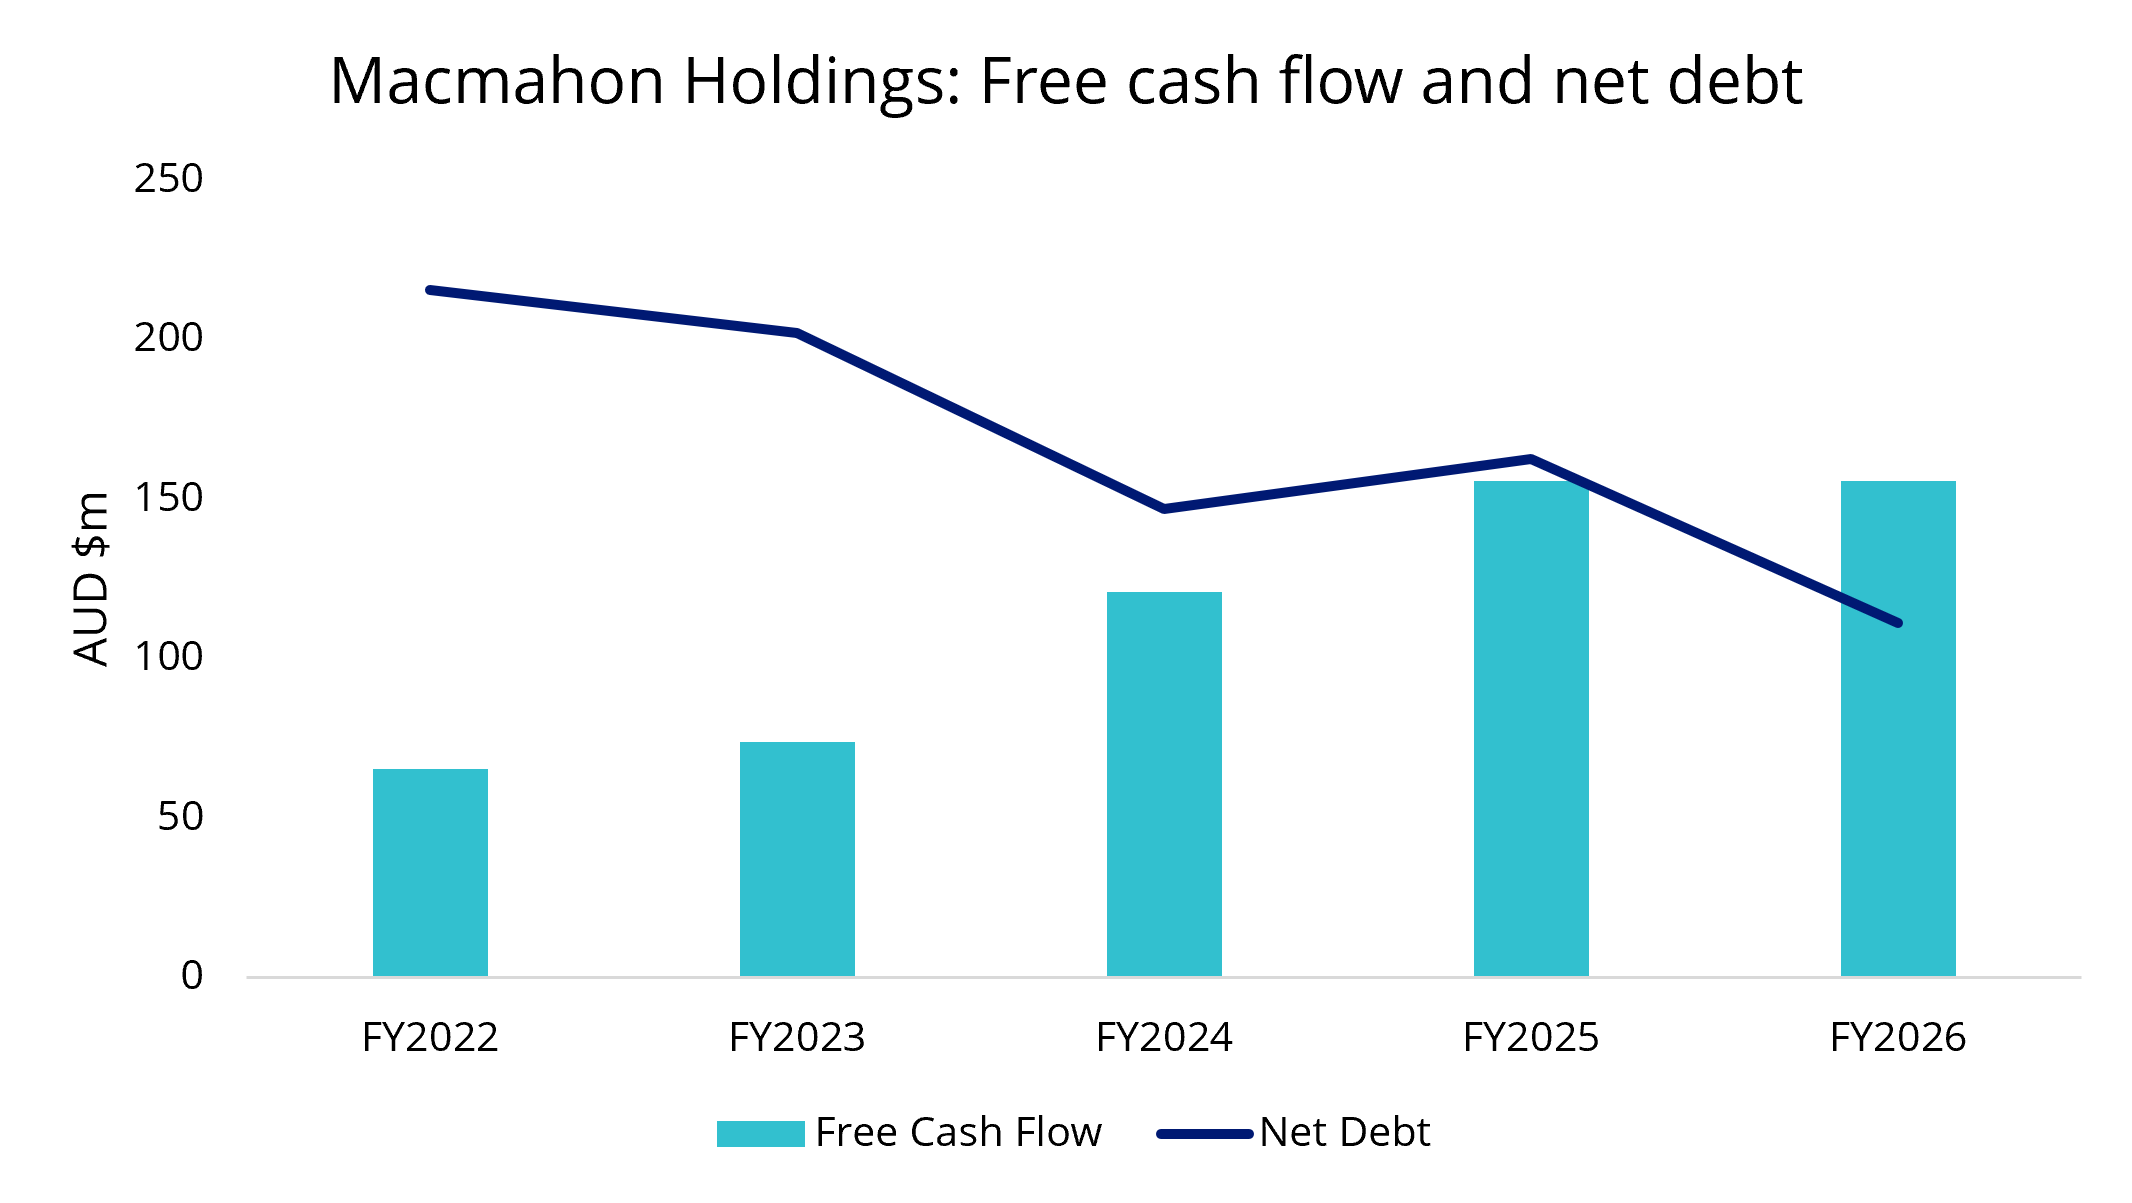
While MAH reported a solid FY26, the main takeaway is the FY27 guidance. FY26 revenue rose 8% to $2.6 billion. Earnings per share growth of 25% year on year which was above consensus. Additionally, the company has seen a steady increase in free cash flow and drop in net debt which the market has viewed favourably.
Macmahon Holdings: Free cash flow and net debt
Source: Bloomberg, as at 18 August 2026. Past performance is not indicative of future performance.
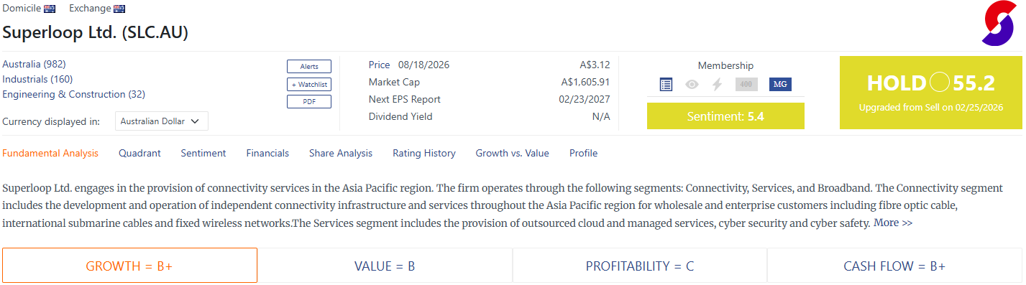
Another relatively higher scorer in MVS is Superloop (ASX: SLC), which rose following its recent results.
Source: MarketGrader Research, 18 August 2026. Not a recommendation to act.
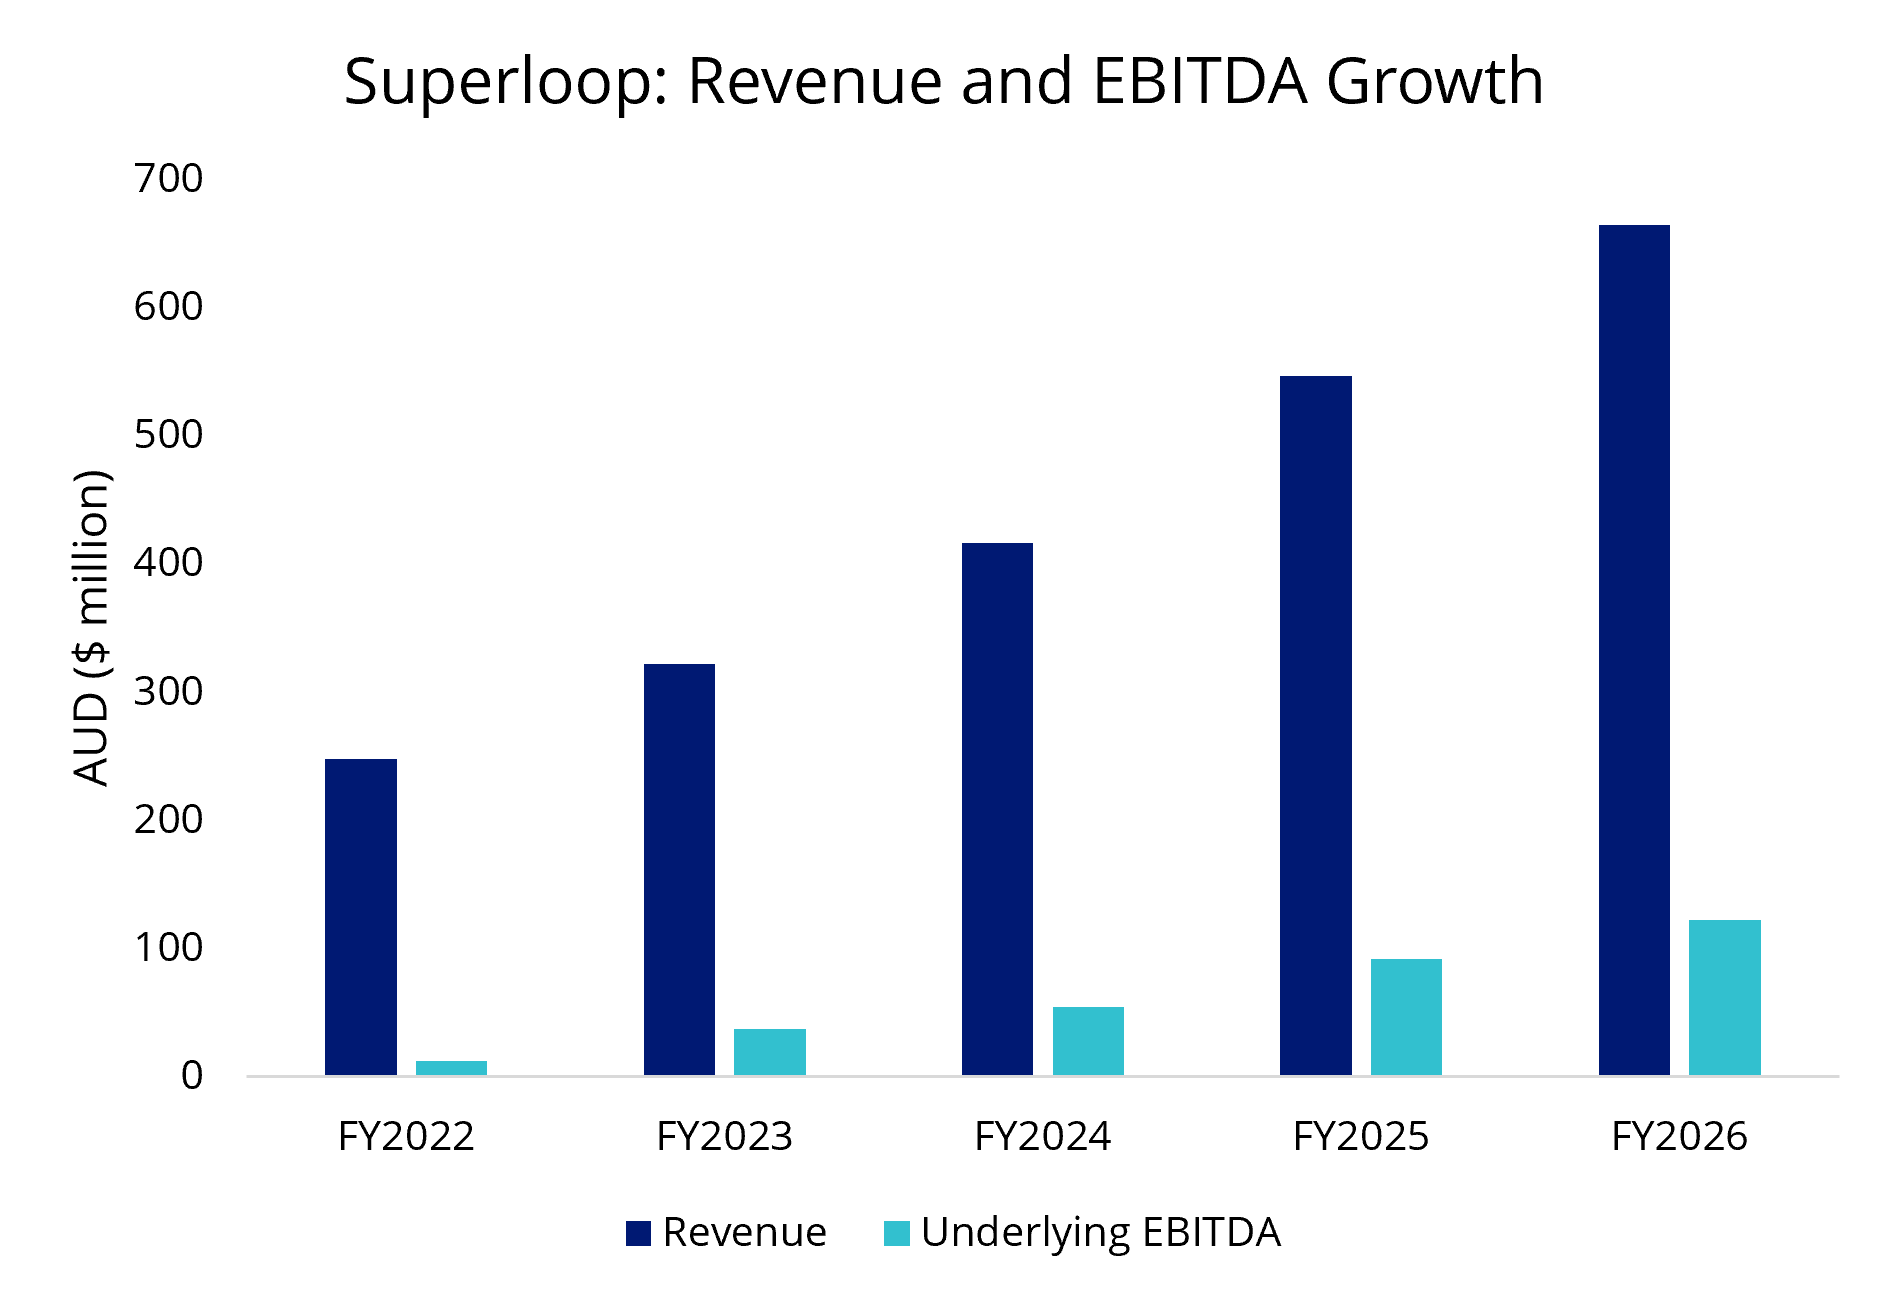
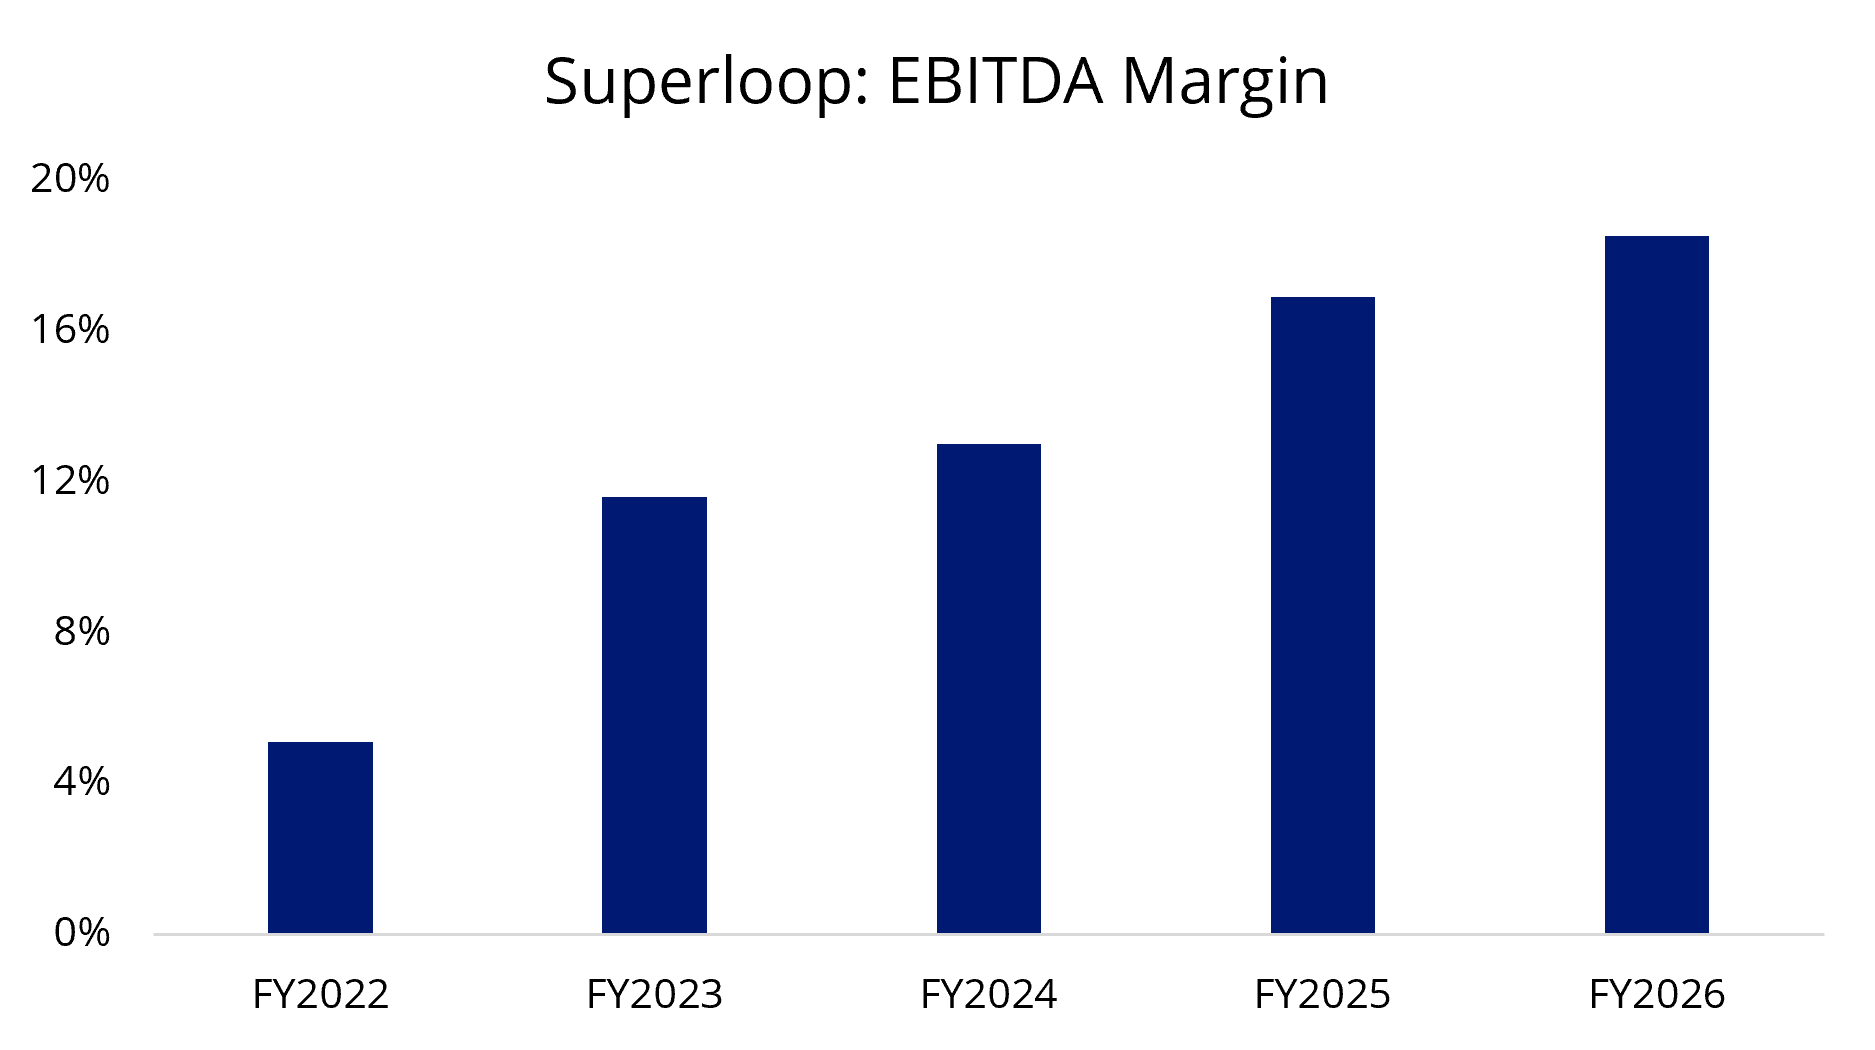
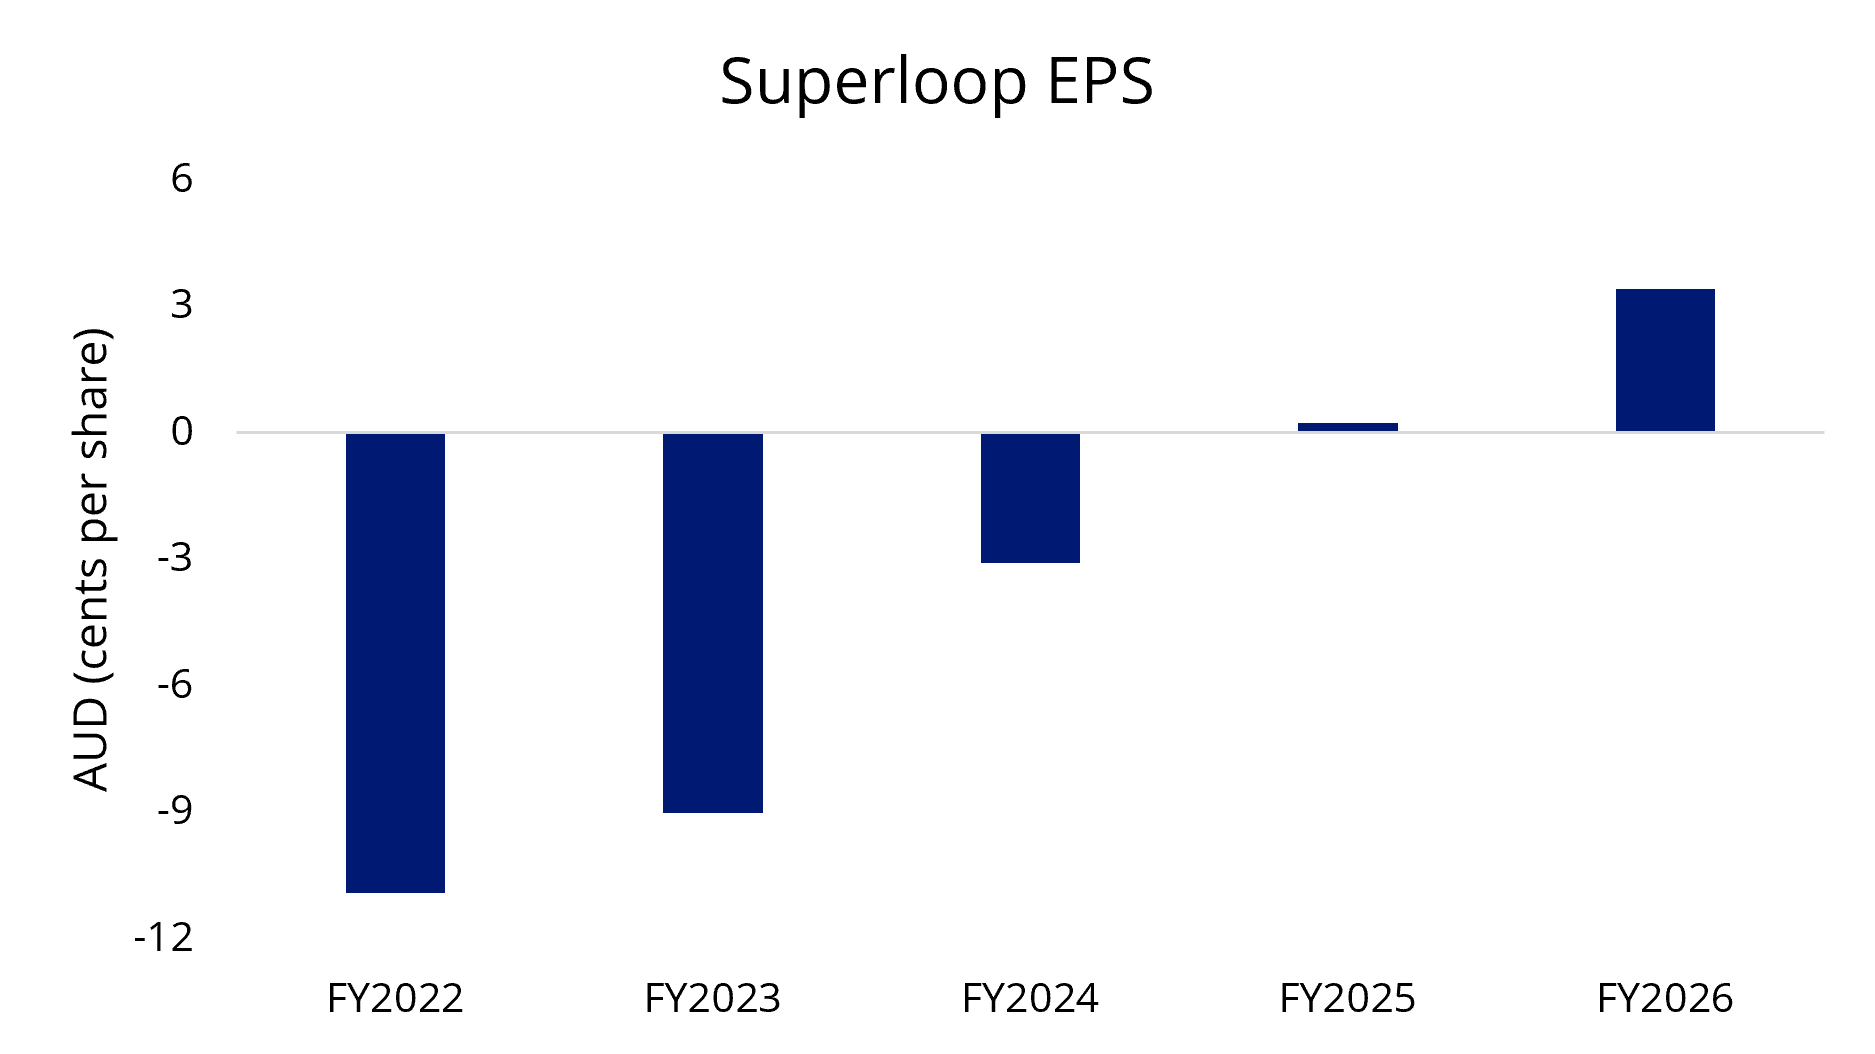
Superloop’s FY2026 revenue was broadly in line with consensus, while underlying EBITDA (Earnings Before Interest, Taxes, Depreciation, and Amortisation) of $122.7 million both beat analyst expectations and exceeded the top end of its upgraded guidance. Importantly, EBITDA growth continues to outpace revenue as operating leverage emerges from the expanding customer base. Superloop added around 205,000 net new customers to reach a new total of 935,000. 2026 was also the first time that SLC delivered a fully profitable fiscal year. The company delivered an NPAT of $17.5 million NPAT (New Profit After Tax) versus a $52.6m loss just four years ago. Another standout figure was free cash flow, which was up 50% to $84.4 million, demonstrating that SLC’s growth is increasingly translating into cash and providing a stronger foundation for its next phase.
Superloop: Revenue and EBITDA Growth
Source: Bloomberg, as at 19 August 2026. Past performance is not indicative of future performance.
Superloop: EBITDA Margin
Source: Bloomberg, as at 19 August 2026. Past performance is not indicative of future performance.
Superloop: EPS
Source: Bloomberg, as at 19 August 2026. Past performance is not indicative of future performance.
Translating into performance
Reflecting recent dynamics, MVS has had strong relative performance over the past few months, noting that past performance should not be relied upon for future performance. It should also be noted that MVS started tracking the MarketGrader Australia Small Cap 60 Index on 23 September 2024. Before that time, it tracked a different index.
Table 1: MVS Trailing performance to 20 August 2026
| 1 mth (%) | 3 mths (%) | 6 mths (%) | YTD (%) |
1 yr (%) |
Since MVS Index change (% p.a.) | 3 yrs (% p.a.) |
5 yrs (% p.a.) |
10 yrs (% p.a.) |
|
| MVS | 10.45 | 16.09 | 1.68 | -2.24 | 7.03 | 10.75 | 10.77 | 3.74 | 5.78 |
| S&P/ASX Small Ordinaries Index | 7.78 | 8.10 | -2.05 | -3.88 | 5.72 | 11.11 | 11.27 | 3.31 | 6.40 |
| Difference | +2.67 | +7.99 | +3.73 | +1.64 | +1.31 | -0.36 | -0.50 | +0.43 | -0.62 |
MVS Inception date is 26 May 2015. Effective 23 September 2024, MVS’ reference index changed from MVIS Australia Small-Cap Dividend Payers Index to the MarketGrader Australia Small Cap 60 Index with a change to the investment objective. A copy of the factsheet is here.
Source: Morningstar Direct, VanEck. The table above shows past performance of MVS and of the S&P/ASX Small Ordinaries. You cannot invest directly in an index. Results are calculated to the last business day of the month and assume immediate reinvestment of distributions. MVS results are net of management fees and other costs incurred in the fund, but before brokerage fees and bid/ask spreads incurred when investors buy/sell on the ASX. Returns for periods longer than one year are annualised. Past performance is not indicative of future performance. The S&P/ASX Small Ordinaries Index (“Small Ords”) is shown for comparison purposes as it is the widely recognised benchmark used to measure the performance of the 200 ASX-listed companies included in the S&P/ASX 300 but not in the S&P/ASX 100, weighted by market capitalisation. The MarketGrader Small Cap 60 Index measures the performance of a portfolio of 60 small-cap companies, 60 Australian small companies with the best growth at a reasonable price (GARP) attributes and the highest earnings yield at rebalance. It has fewer securities and different industry allocations than the Small Ords. ‘Click here for more details’
The benefits of MVS’ approach
The advantage of the MVS approach, in addition to low fees and full transparency, is that it follows a rules-based strategy meaning no investment manager’s bias can sway the portfolio. The portfolio won’t hold onto a stock for too long because someone is in love with it nor will it trade because of a feeling.
This innovative approach gives investors the best of both active and passive worlds: a portfolio with the potential to outperform like an actively managed fund with the benefits of low costs associated with passive management.
While different small company approaches can be considered for portfolio inclusion, you should assess all the risks and consider your investment objectives.
Key risks
An investment in the ETF carries risks associated with: financial markets generally, individual company management, industry sectors, stock and sector concentration, fund operations and tracking an index. PDS and TMD for more details.
1 - Banz, R. W. (1981). “The relationship between return and market value of common stocks,” Journal of Financial Economics 9(1), 3–18.


Published: 21 August 2026
Any views expressed are opinions of the author at the time of writing and is not a recommendation to act.
VanEck Investments Limited (ACN 146 596 116 AFSL 416755) (VanEck) is the issuer and responsible entity of all VanEck exchange traded funds (Funds) trading on the ASX. This information is general in nature and not personal advice, it does not take into account any person’s financial objectives, situation or needs. The product disclosure statement (PDS) and the target market determination (TMD) for all Funds are available at vaneck.com.au. You should consider whether or not an investment in any Fund is appropriate for you. Investments in a Fund involve risks associated with financial markets. These risks vary depending on a Fund’s investment objective. Refer to the applicable PDS and TMD for more details on risks. Investment returns and capital are not guaranteed.
“MarketGrader" and the MarketGrader Australia Small Cap 60 Index are trademarks of MarketGrader.com Corp. and have been licensed for use for certain purposes by VanEck. VanEck Small Companies Masters ETF (MVS) is based on the MarketGrader Australia Small Cap 60 Index , but is not sponsored, endorsed, sold or promoted by MarketGrader, and MarketGrader makes no representation regarding the advisability of investing in MVS.