A refined opportunity in Australian energy stocks


Crude oil has surged past US$107/barrel after Saudi Arabia closed its east-west oil pipeline following a drone attack. If oil stays near these levels, the consequences will reach much further than the energy sector.
For one, the Reserve Bank of Australia has raised the cash rate three times this year to 4.35%. In August, it warned that disruption to global oil supply was adding to inflation and that rates could rise again if the outlook deteriorated. Last week, deputy governor Andrew Hauser described inflation as the central bank’s “one big problem”.
“The question now, frankly, for us, is have we done enough or is more needed,” Hauser said on the ABC’s 7:30 program.
If oil, which is already up more than 76% this year, remains at these levels and trimmed mean inflation stays above 3%, the case for one further rate rise will be hard to dismiss. A prolonged oil shock could leave a second increase in play, adding pressure to household spending and growth-oriented equity valuations.
Higher oil prices can also support the earnings of energy producers and refiners, creating opportunities for portfolios positioned to benefit.
Oil refuses to retreat
As a reflection of the sustained increase in crude prices, Goldman Sachs recently lifted its year-end forecast from US$80 to US$90 and its average 2027 forecast from US$75 to US$80. It also sees a path above US$120 if Gulf oil output remains well below pre-war levels through 2027, though this is not the investment bank’s central forecast.
The charts below show why the oil price matters beyond the energy sector and possibly why Goldman‘s reversed its oil price forecast after just three months.
The first compares Brent crude with US energy inflation, which have tended to move in the same direction. The second shows a sharp fall in ship crossings through the Strait of Hormuz alongside declining OECD crude and liquid fuel inventories.
If the disruption continues, that shrinking inventory buffer leaves the market with less protection against further price rises.
Charts 1 and 2: Oil could remain higher for longer
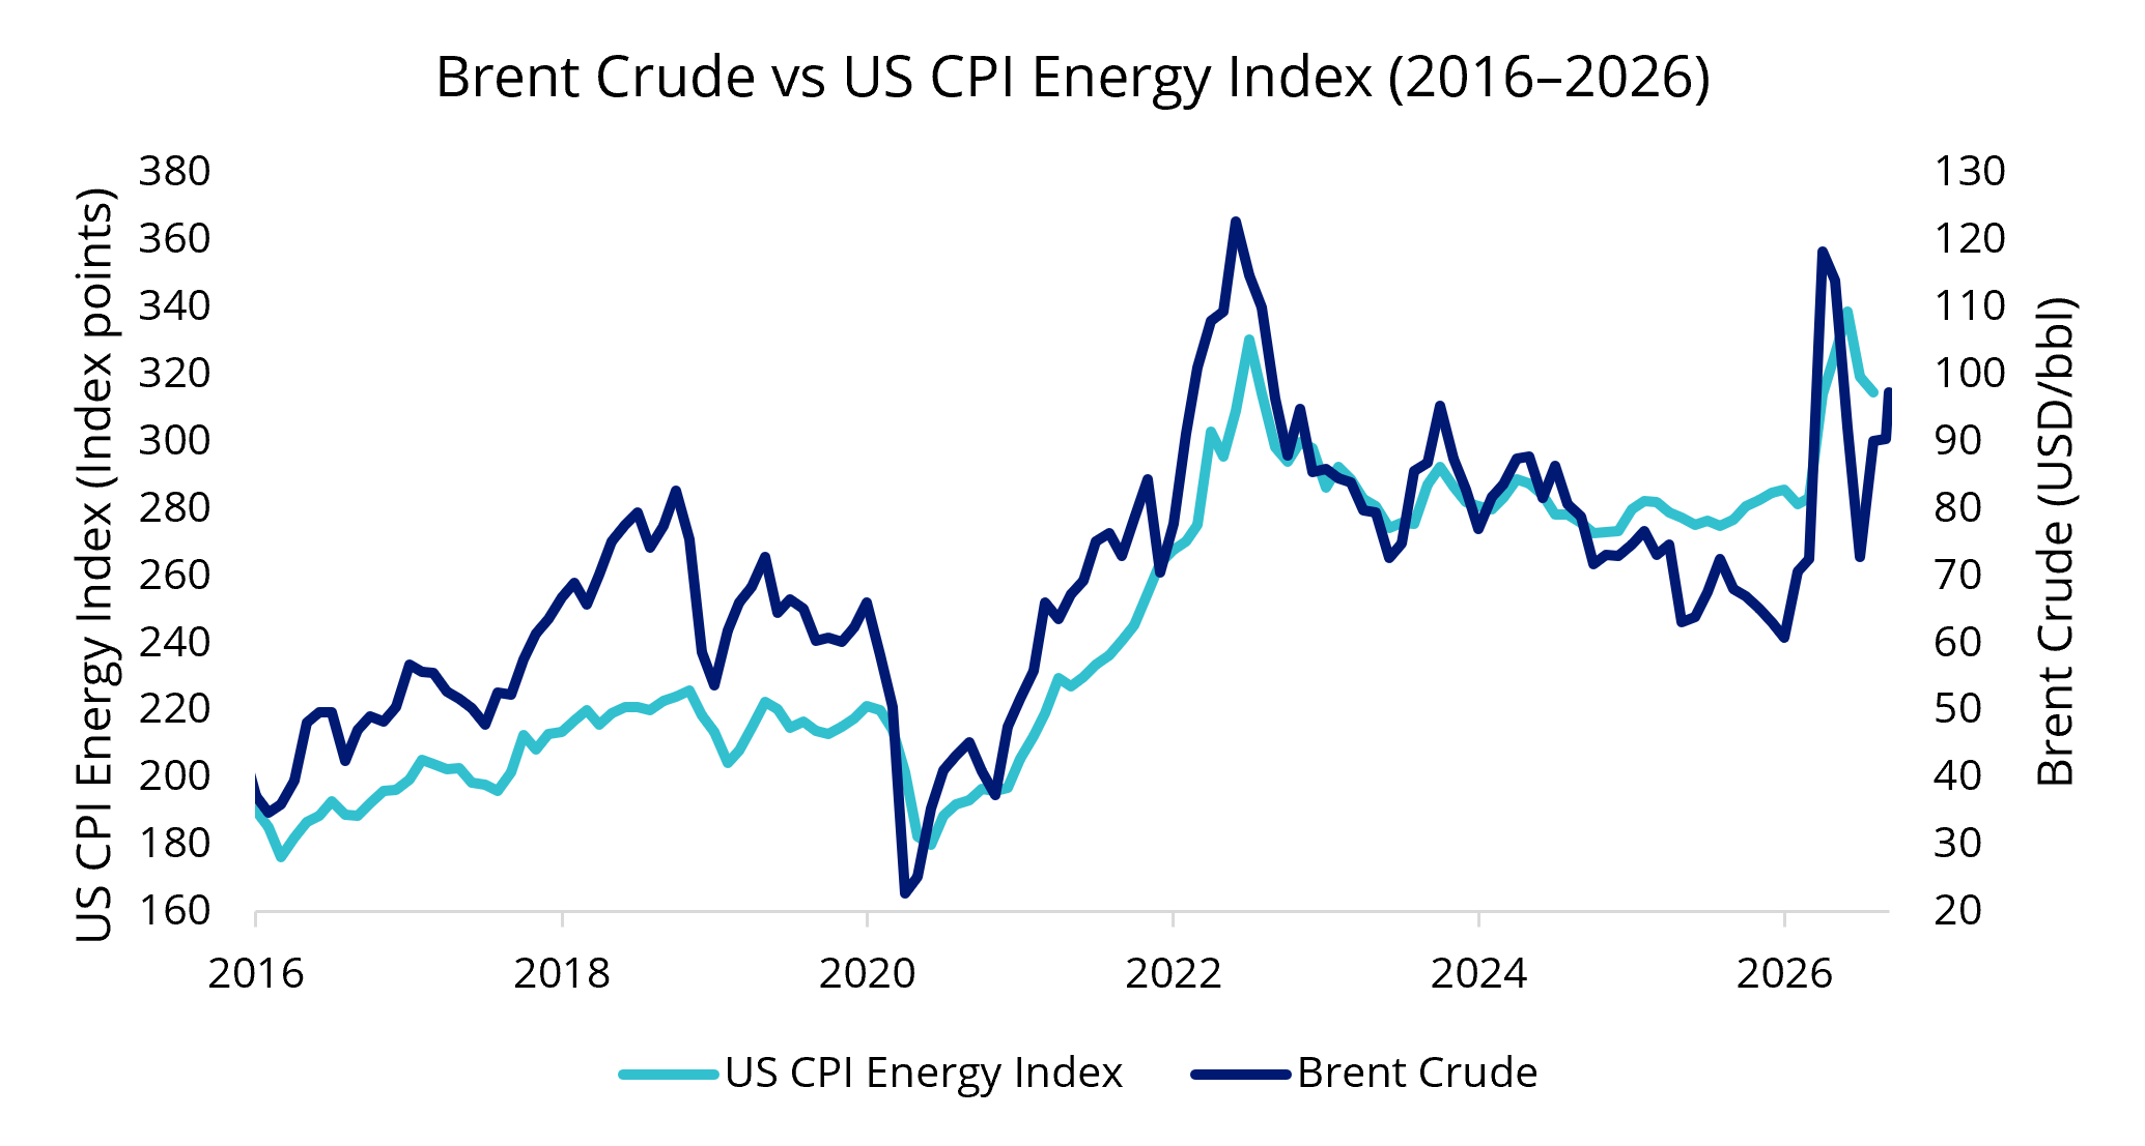
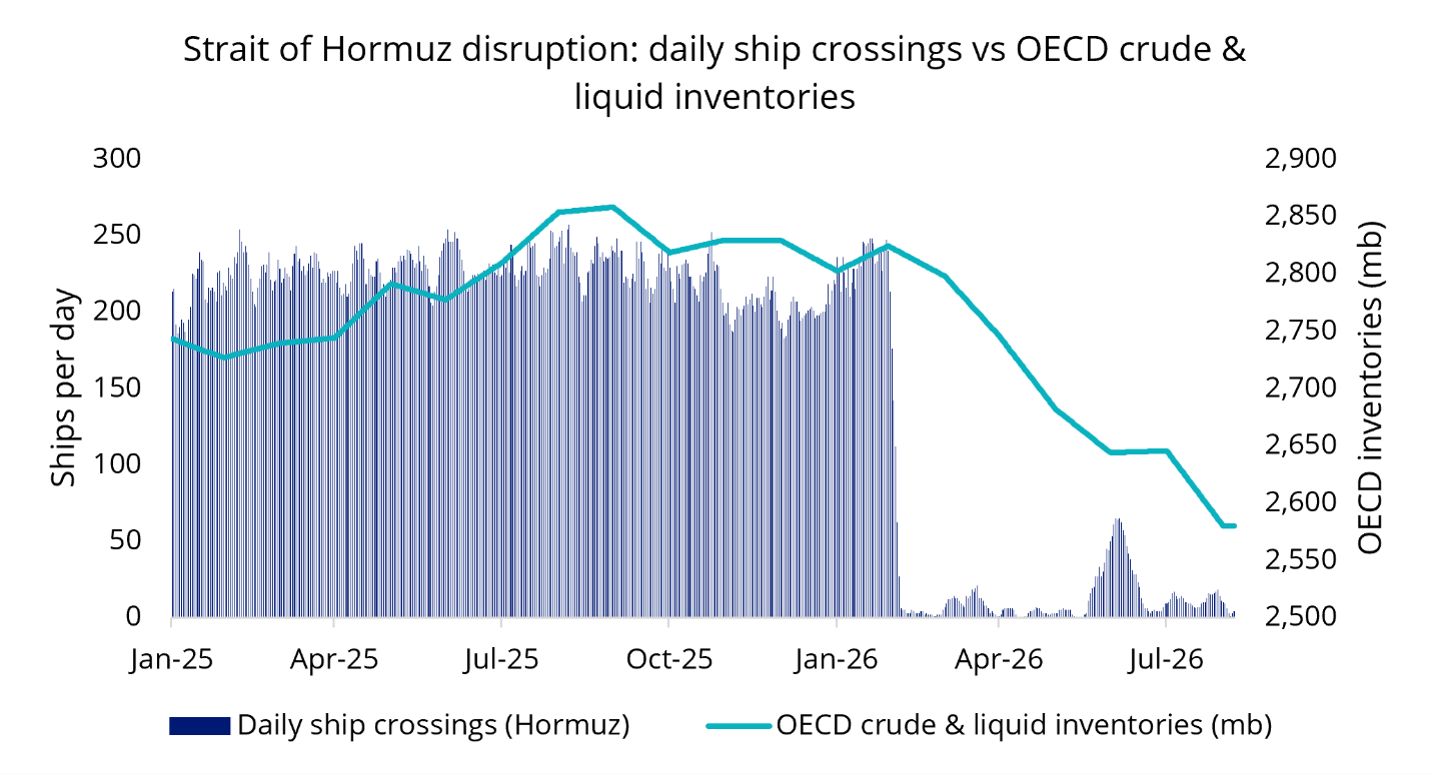
Source: Bloomberg. Data as at 31 August 2026. Brent crude represented by CO1 Comdty; US CPI Energy Index by CPUPENER Index; daily Strait of Hormuz ship crossings by TRHETKCT Index; OECD crude and liquid inventories by ST14IC Index.
The upside is already visible
While higher oil prices present a challenge for the wider economy, investors are exposed to the other side of the story, which is that favourable industry conditions can produce substantial returns.
From the beginning of 2026 to the end of August, global oil refiners returned around 50% and Australian oil refiner Ampol (ASX: ALD) gained close to 40%. International equities returned about 5% over the same period.
Chart 3: Energy companies have captured the upside
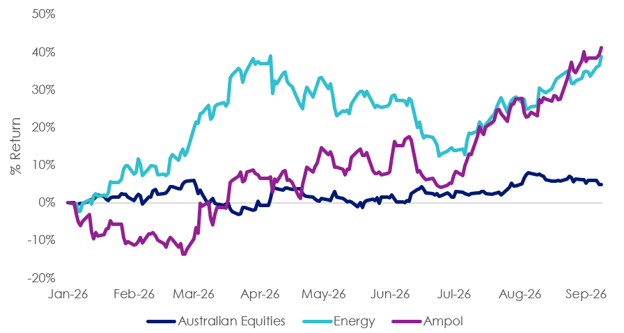
Source: Bloomberg, 1 January 2026 to 9 September 2026. Energy represented by S&P/ASX 200 Energy Index. Australian Equities is represented by S&P/ASX 200. Past performance is not indicative of future performance.
These gains do not mean every energy company will benefit to the same extent. However, they do show the size of the opportunity when stronger industry conditions flow through to company earnings.
A core built for a broader market
The VanEck Australian Equal Weight ETF (MVW) equally weights a portfolio of large and liquid Australian companies at each quarterly rebalance. This reduces the influence of the largest banks and miners while preserving broad market exposure and increasing the contribution of other sectors. Energy represented 5.5% of MVW’s index (as at 31 August 2026), compared with the 4.6% weighting in the S&P/ASX 200.
The latest SPIVA Australia scorecard shows how difficult it has been for active managers to outperform a broad benchmark. It found that 78% of Australian Equity General funds underperformed the S&P/ASX 200 in the first half of 2026. Over 15 years, 89% have underperformed.
MVW’s differentiated approach has delivered for investors, outperforming the S&P/ASX 200 Index since inception as well as in recent months. If higher oil prices continue to support Australian energy stocks, MVW’s greater exposure to the sector, relative to the market benchmark, could help extend that recent lead. Note that past performance is not indicative of future performance.
More energy without another BHP holding
The VanEck Australian Resources ETF (MVR) provides a stronger resources and energy tilt. As at 27 August 2026, oil and gas represented 19.2% of MVR, compared with 11.4% of the S&P/ASX 200 Resources Index.
The difference comes from how MVR is built. Its index caps each company at 8% at rebalance, preventing one company (BHP) from dominating the portfolio. As a result of the cap, the weight released from BHP is spread across energy producers, gold miners, critical minerals companies and other parts of the resources sector.
That gives investors more exposure to companies that may benefit from higher oil prices without making the entire allocation dependent on one commodity or company.
Chart 4: MVR offers more diversified resources exposure
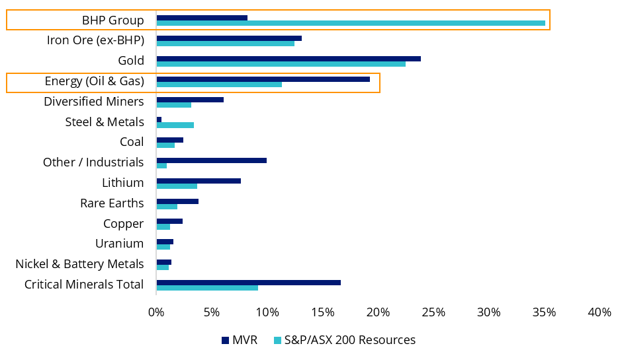
Source: Morningstar, FactSet, as at 27 August 2026. MVR is VanEck Australian Resources ETF.
MVR has outperformed the S&P/ASX 200 Resources Index since its inception by 0.68% p.a. (as at 31 August 2026).
ALFA has already changed course
The VanEck Australian Long Short Complex ETF (ALFA) adds a different type of exposure. Its systematic process can increase positions in companies it expects to outperform and short those where the outlook is weaker.
The portfolio’s active allocation to energy moved from an underweight to overweight in early 2026, as inflation began to accelerate, reflecting these sectors’ inflation-linked revenue streams and pricing power. As at 9 September 2026, the fund has a 9% active overweight to the energy sector, with long positions in Santos, Woodside and Ampol.
Chart 5: ALFA turned overweight energy and utilities (pricing power sectors) in early 2026
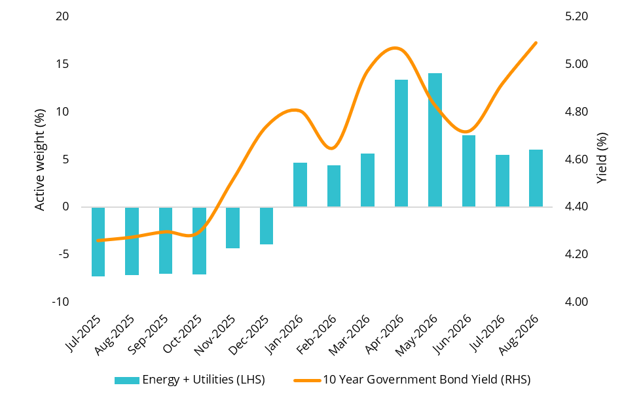
Source: VanEck, Bloomberg, July 2025 to August 2026. Past performance is not indicative of future performance.
Higher oil prices remain a threat to inflation, interest rates and household spending. But they could also create an earnings tailwind for selected Australian energy companies. Falling refined oil inventories could keep crack spreads, the difference between the value of refined petroleum products sold and the cost of the crude oil used to produce them, elevated and support higher profit margins.
Chart 6: Brent oil price versus crack spread
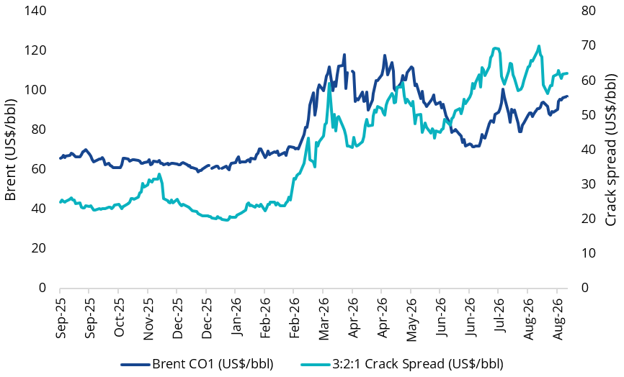
Source: VanEck, Bloomberg. To 7 September 2026. Brent CO1 is an index representing Brent Crude Energy Futures. 3:2:1 Crack Spread is Bloomberg Nymex WTI Cushing Crude Oil First Month 321 Crack Spread. The 3-2-1 crack spread is a commonly used benchmark used to estimate the gross profit margin a refinery makes when processing three barrels of crude oil into two barrels of gasoline and one barrel of distillate (such as diesel or heating oil). A higher crack spread indicates stronger potential profits for oil refiners, often leading to gains in refining and energy sector stocks. Past performance is not an indicator of future performance.
Investors can retain a diversified Australian equity core while seeking greater exposure to companies that may benefit from higher oil prices. MVW can provide the diversified core, MVR can increase resources and energy exposure, and ALFA can seek out the companies that may be best placed for the environment ahead.
Key risks
MVW and MVR carry risks associated with financial markets generally, individual company management, industry sectors, fund operations and index tracking. MVR also carries stock and sector concentration risk. See the funds' PDS and TMD for more details.
ALFA has higher investment risk than a comparable fund that does not use short selling and leverage. Investors should regularly monitor their investment to ensure it aligns with their objectives. Key risks include short selling, leverage, prime broker, counterparty, concentration, operational and material portfolio information risks. See the fund’s PDS and TMD for details.


Published: 14 September 2026
Any views expressed are opinions of the author at the time of writing and is not a recommendation to act.
VanEck Investments Limited (ACN 146 596 116 AFSL 416755) (VanEck) is the issuer and responsible entity of all VanEck exchange traded funds (Funds) trading on the ASX. This information is general in nature and not personal advice, it does not take into account any person’s financial objectives, situation or needs. You should consider whether or not an investment in any Fund is appropriate for you. Investments in a Fund involve risks associated with financial markets. These risks vary depending on a Fund’s investment objective. Refer to the applicable product disclosure statement (PDS) and target market determination (TMD) available at vaneck.com.au for more details. Investment returns and capital are not guaranteed.