Panning for gold after August reporting season


Higher interest rates are no longer only a problem for homeowners. Their effects are spreading through corporate Australia, weakening demand for housing loans, putting pressure on household spending and punishing companies that offered investors little confidence about the year ahead.
However, reporting season was not weak across the board. Resources companies benefited from higher production and commodity prices, selected property companies delivered stronger rents and occupancy while select small caps offered earnings growth that used to be achieved by the share market’s largest names.
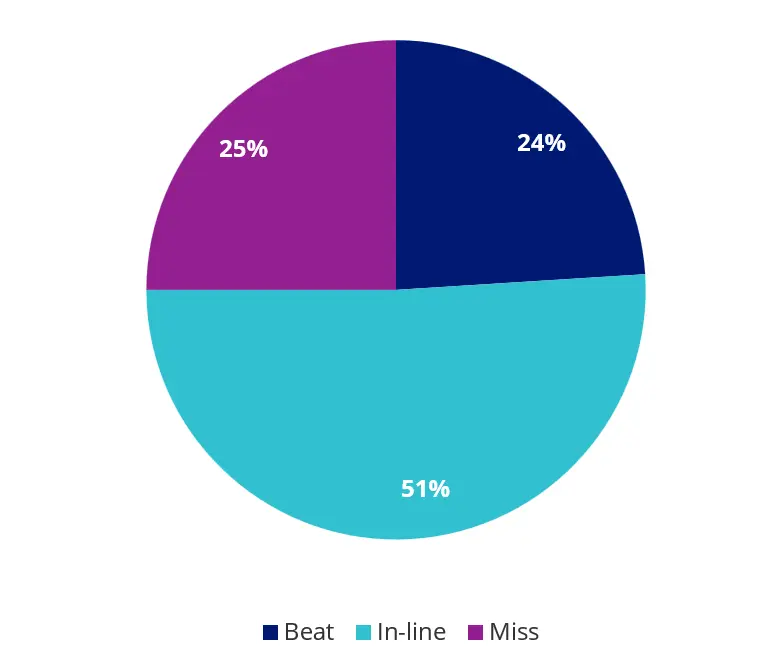
When all is said and done, only 24% of S&P/ASX 200 companies reported results ahead of analyst expectations, while 25% fell short and 51% were broadly in line. Yet the index rose 1.6%, as some of the richest finds emerged in the sectors and companies receiving fewer headlines.
Chart 1: Most S&P/ASX 200 companies did not beat expectations
Source: Bloomberg, VanEck. Based on S&P/ASX 200 company results reported during the August 2026 reporting season versus consensus estimates. As at 25 August 2026.
Banks: Good results, difficult starting points
Bank results broadly met expectations, but investors were less impressed by the outlook.
Westpac (ASX: WBC) was the clearest example. Its shares fell almost 6% after it reported that mortgage applications had declined 11% during the quarter and 20% following the Federal Budget.
Another interest rate rise could increase the difference between what banks earn on loans and pay on deposits. However, weaker demand for loans and intense competition for borrowers and deposits may offset that benefit.
Commonwealth Bank (ASX: CBA) faced a different challenge. Investors already pay considerably more for each dollar of CBA’s earnings than they do for owning the other major banks. That high starting valuation left its share price with little room for error.
This also highlights the concentration within Australia’s share market. The VanEck Australian Equal Weight ETF (ASX: MVW) reduces the influence of the largest banks by giving each company a more even role in the portfolio.
The VanEck Geared Australian Equal Weight Complex ETF (ASX: GMVW) provides geared exposure to the same strategy. It combines investors’ money with borrowed funds to invest in MVW. This can increase gains when the market rises, but it also magnifies losses when the market falls and therefore involves considerably greater risk.
Materials: It’s not all about The Big Australian
BHP (ASX: BHP) attracted plenty of attention during reporting season, and for good reason. Underlying profit rose 30%, its full-year dividend was the highest in four years, and for the first time in its long history, copper became BHP’s largest earnings contributor. The strength of copper earnings reflects the company’s growing exposure to a metal used extensively in electricity networks, renewable energy systems and data centres.
But BHP was far from the only strong result among Australian resources companies. Some of the best performances came from mid-sized and smaller miners that received far fewer headlines.
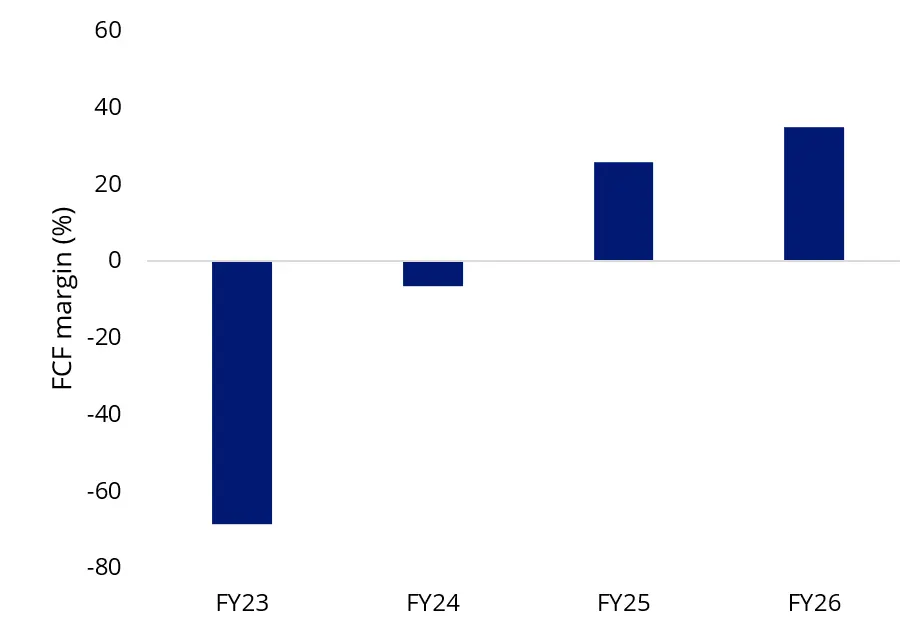
Genesis Minerals (ASX: GMD) was one standout. Revenue rose 89% and underlying earnings more than doubled as the company increased production, benefited from record gold prices and kept costs under control. Its free-cash-flow margin reached almost 35%, meaning it converted nearly 35 cents of every dollar of revenue into cash after meeting its operating and investment expenses.
Chart 2: Genesis Minerals free-cash-flow margin
Source: Genesis Minerals company reports, Bloomberg, VanEck. Free-cash-flow margin. As at 25 August 2026. Past performance is not indicative of future performance.
The VanEck Australian Resources ETF (ASX: MVR) captures more of this breadth by limiting the influence of the sector’s largest companies. As at 31 August 2026, BHP represented 8.1% of MVR, compared with 39.2% of the S&P/ASX 200 Resources Index.
This gives companies such as Genesis Minerals a meaningful role in the portfolio and allows their performance to make a greater difference to investor returns.
Size mattered
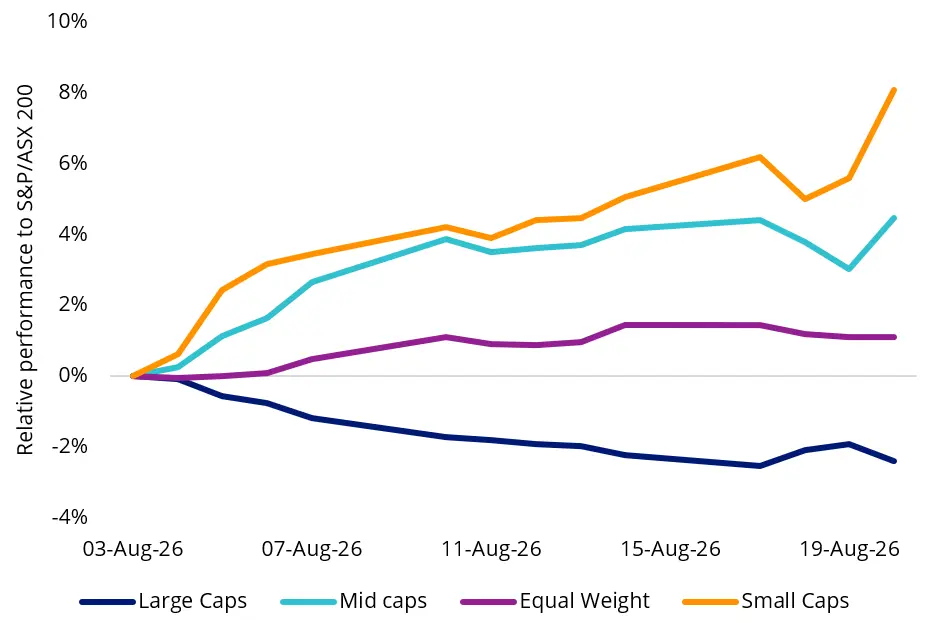
Smaller companies were among reporting season’s strongest performers. As the chart below shows, the S&P/ASX Small Ordinaries outperformed the S&P/ASX 200 by around 3.3% during August, while large caps underperformed the index by more than 2%.
That does not mean every smaller company performed well. These businesses can be more volatile and may carry greater risks than larger, more established companies. Selecting profitable businesses with attractive growth prospects at reasonable prices therefore remains important.
We recently explored this opportunity in greater detail, including two company examples, in Sometimes it’s the little things. The VanEck Small Companies Masters ETF (ASX: MVS) seeks exposure to Australian smaller companies displaying growth at a reasonable price.
Chart 3: The performance of companies of different sizes during August reporting season
Source: Bloomberg. ASX size indices. Equal Weight is the MVIS Australia Equal Weight Index. Performance in Australian dollars. Past performance is not indicative of future performance. You cannot invest directly in an index. As at 25 August 2026.
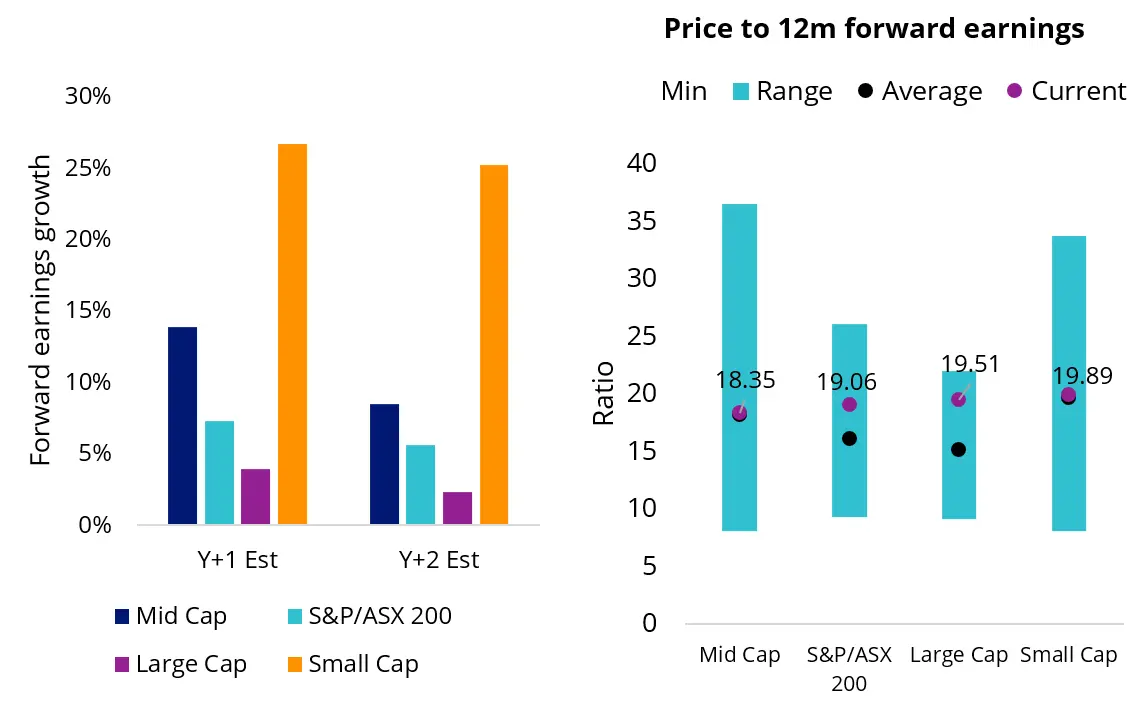
The earnings outlook also favours companies outside the large-cap end of the market. Analyst forecasts suggest earnings per share among small companies could grow by about 28% over the next year, compared with just 4% for large companies. Mid-sized companies are also expected to grow considerably faster than the broader S&P/ASX 200.
Analyst price targets point in the same direction, although forecasts and price targets can change and should never be treated as guaranteed returns.
Charts 4 and 5: Earnings growth and analyst price targets favour smaller companies
Source: Bloomberg consensus estimates, VanEck. ASX size indices. As at 25 August 2026. Forecasts are not guaranteed and are subject to change.
And while the forecasts may not prove exactly correct, the size of the gap is difficult to ignore.
Australian REITs: No rate cuts? No problem
Australian real estate investment trusts, or A-REITs, did not need lower interest rates to produce some of reporting season’s stronger results. Listed property companies with improving occupancy and rental income were rewarded by investors.
Mirvac (ASX: MGR) was one of the standouts, with its shares rising as much as 9% after its result. Operating profit increased 7%, while occupancy across its office properties exceeded 96% and income from comparable office properties rose 4.3% during the 2026 financial year.
Mirvac expects its investment portfolio to deliver income growth in FY27 for the first time since FY23 as two years of property sales wind down. Recently completed and committed developments are also expected to contribute around $130 million of additional income over the next three years.
As at 31 August 2026, Mirvac represented approximately 11% of the VanEck Australian Property ETF (ASX: MVA). The value of MVA’s underlying properties, after liabilities, also remained above the portfolio’s share market value. This gives investors the potential to benefit from both improving property income and any recovery in valuations.
MVA has also delivered the higher income traditionally associated with the property sector. As at 31 July 2026, its dividend yield was 4.65%, compared with 3.39% for the S&P/ASX 200 A-REITs Index and 3.26% for the broader S&P/ASX 200.
Many gems still to be discovered
Reporting season did not deliver a simple verdict on corporate Australia. It showed that growth is becoming harder to find but is far from absent. As the banks confront slowing demand for credit, opportunities are emerging among companies that can continue to grow while trading at reasonable valuations. For investors prepared to look beyond the index heavyweights, there are still plenty of gems to uncover.
Key risks
An investment in MVW, MVR, MVS or MVA carries risks associated with financial markets generally, individual company management, industry sectors, stock and sector concentration, fund operations and tracking an index. See the relevant PDS and TMD for more details.
An investment in GMVW carries risk. The Fund borrows money to increase the amount it can invest. While this can result in larger gains in a rising market, it can also magnify losses in a falling market. The greater the level of gearing in the Fund, the greater the potential loss of capital. The Fund is considered to have a higher investment risk than a comparable fund that is ungeared. Investors should actively monitor their investment as frequently as daily to ensure it continues to meet their investment objectives. See the VanEck Geared Australian Equal Weight Complex ETF PDS and TMD for more details.
MVW is likely to be appropriate for a consumer who is seeking capital growth and a regular income distribution, is intending to use the product as a core, minor or satellite allocation within a portfolio, has an investment timeframe of at least five years, and has a high risk/return profile.
MVR, MVS and MVA are each likely to be appropriate for a consumer who is seeking capital growth and a regular income distribution, is intending to use the product as a minor or satellite allocation within a portfolio, has an investment timeframe of at least five years, and has a high risk/return profile.
GMVW is likely to be appropriate for a consumer who is seeking capital growth and a regular income distribution, is intending to use the product as a core, minor or satellite allocation within a portfolio, has an investment timeframe of at least seven years, and has an extremely high risk/return profile.


Published: 01 September 2026
Any views expressed are opinions of the author at the time of writing and is not a recommendation to act.
VanEck Investments Limited (ACN 146 596 116 AFSL 416755) (VanEck) is the issuer and responsible entity of all VanEck exchange traded funds (Funds) trading on the ASX. This information is general in nature and not personal advice, it does not take into account any person’s financial objectives, situation or needs. The product disclosure statement (PDS) and the target market determination (TMD) for all Funds are available at vaneck.com.au. You should consider whether or not an investment in any Fund is appropriate for you. Investments in a Fund involve risks associated with financial markets. These risks vary depending on a Fund’s investment objective. Refer to the applicable PDS and TMD for more details on risks. Investment returns and capital are not guaranteed.