2 ASX stocks that demonstrate true quality


Quality is something Australians seek in all facets of life. Why should this be different when it comes to building an investment portfolio?
Quality is something that everyday Australians seek across many facets of life. We value durability, reliability and comfort because products and services built to last tend to serve us better over time.
The same principle applies to investing. Companies with durable earnings, strong balance sheets and disciplined management can form the backbone of a diversified share portfolio. Quality companies can participate when conditions are favourable but tend to prove their worth when markets and the economy come under pressure.
That benefit, however, depends on an investment delivering what it says on the tin. In the Australian share market, genuine quality may be harder to find than many investors realise.
A more challenging economic backdrop
The Australian share market’s performance is increasingly being driven by the realities of operating in a sluggish economy. Forward earnings growth in Australia now sits materially below the global average following the August reporting season.
Chart 1: Forward earnings per share (EPS) growth: Australian equities vs US equities
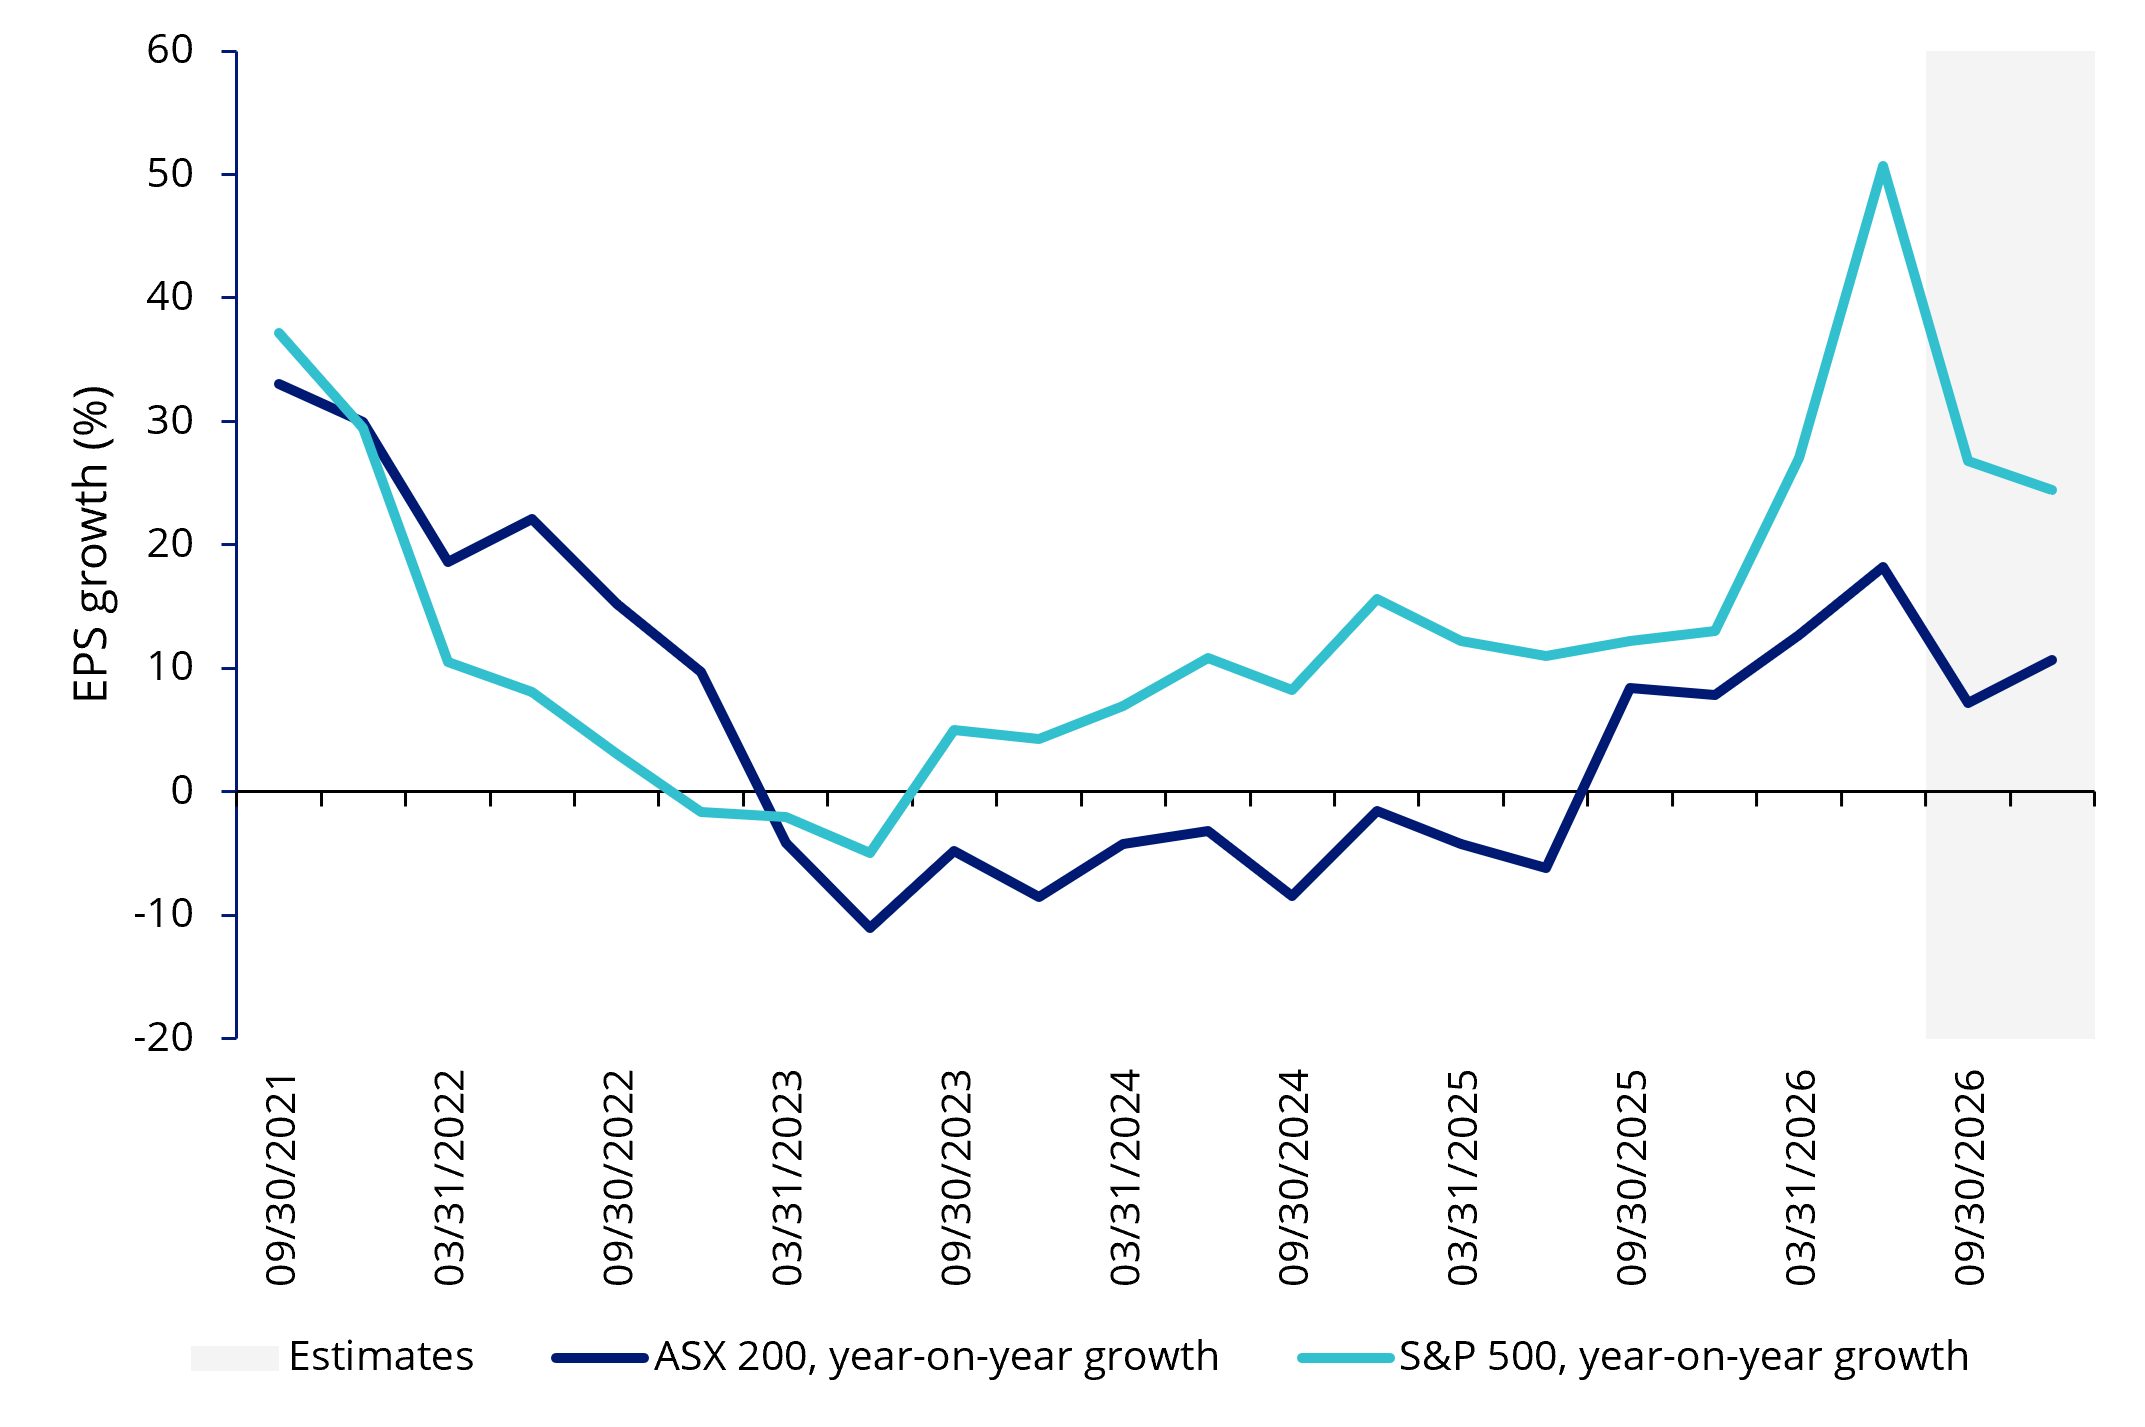
Source: Bloomberg, as at 25 September 2026.
On the macro front, elevated crude oil prices continue to pressure the cost of living and complicate the Reserve Bank of Australia’s efforts to bring inflation back under control. Underlying inflation, as measured by the RBA’s preferred trimmed mean reading, sat at 3.6% in August and has not moved for three consecutive months.
If this continues to remain the case, and the unemployment rate stays steady and GDP growth continues to soften, the Australian economy could face a prolonged period of stagflation or even a recession.
One of the most obvious manifestations of successive interest rate hikes is the hits to consumer and business sentiment. The major business confidence index measure has been negative for seven straight months while pessimistic consumers have outnumbered optimistic consumers since December 2025.
Together, these pressures threaten business revenues, margins, and valuations, and raise the potential for further share market volatility.
Charts 2 and 3: Business and consumer confidence
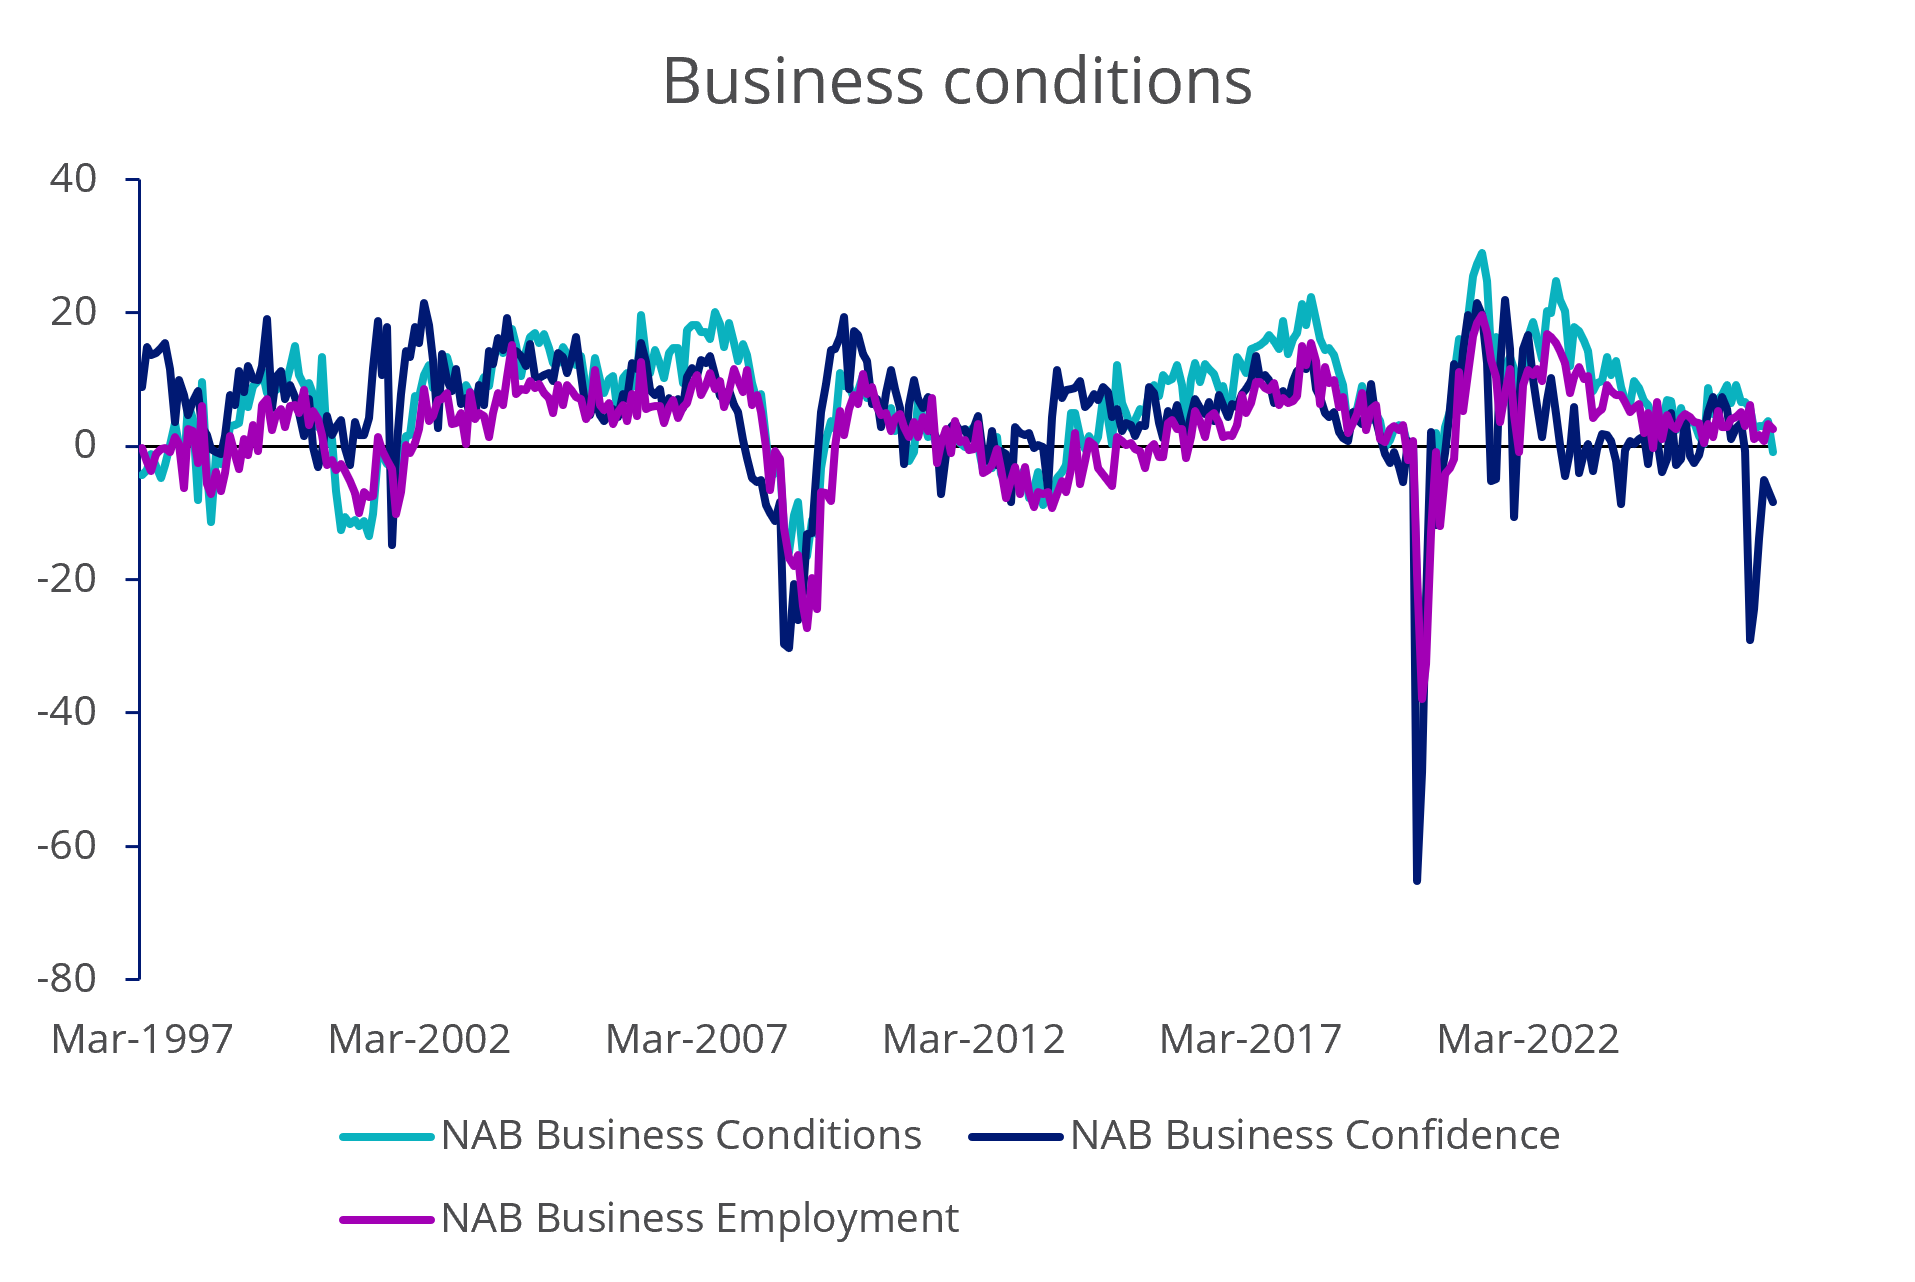
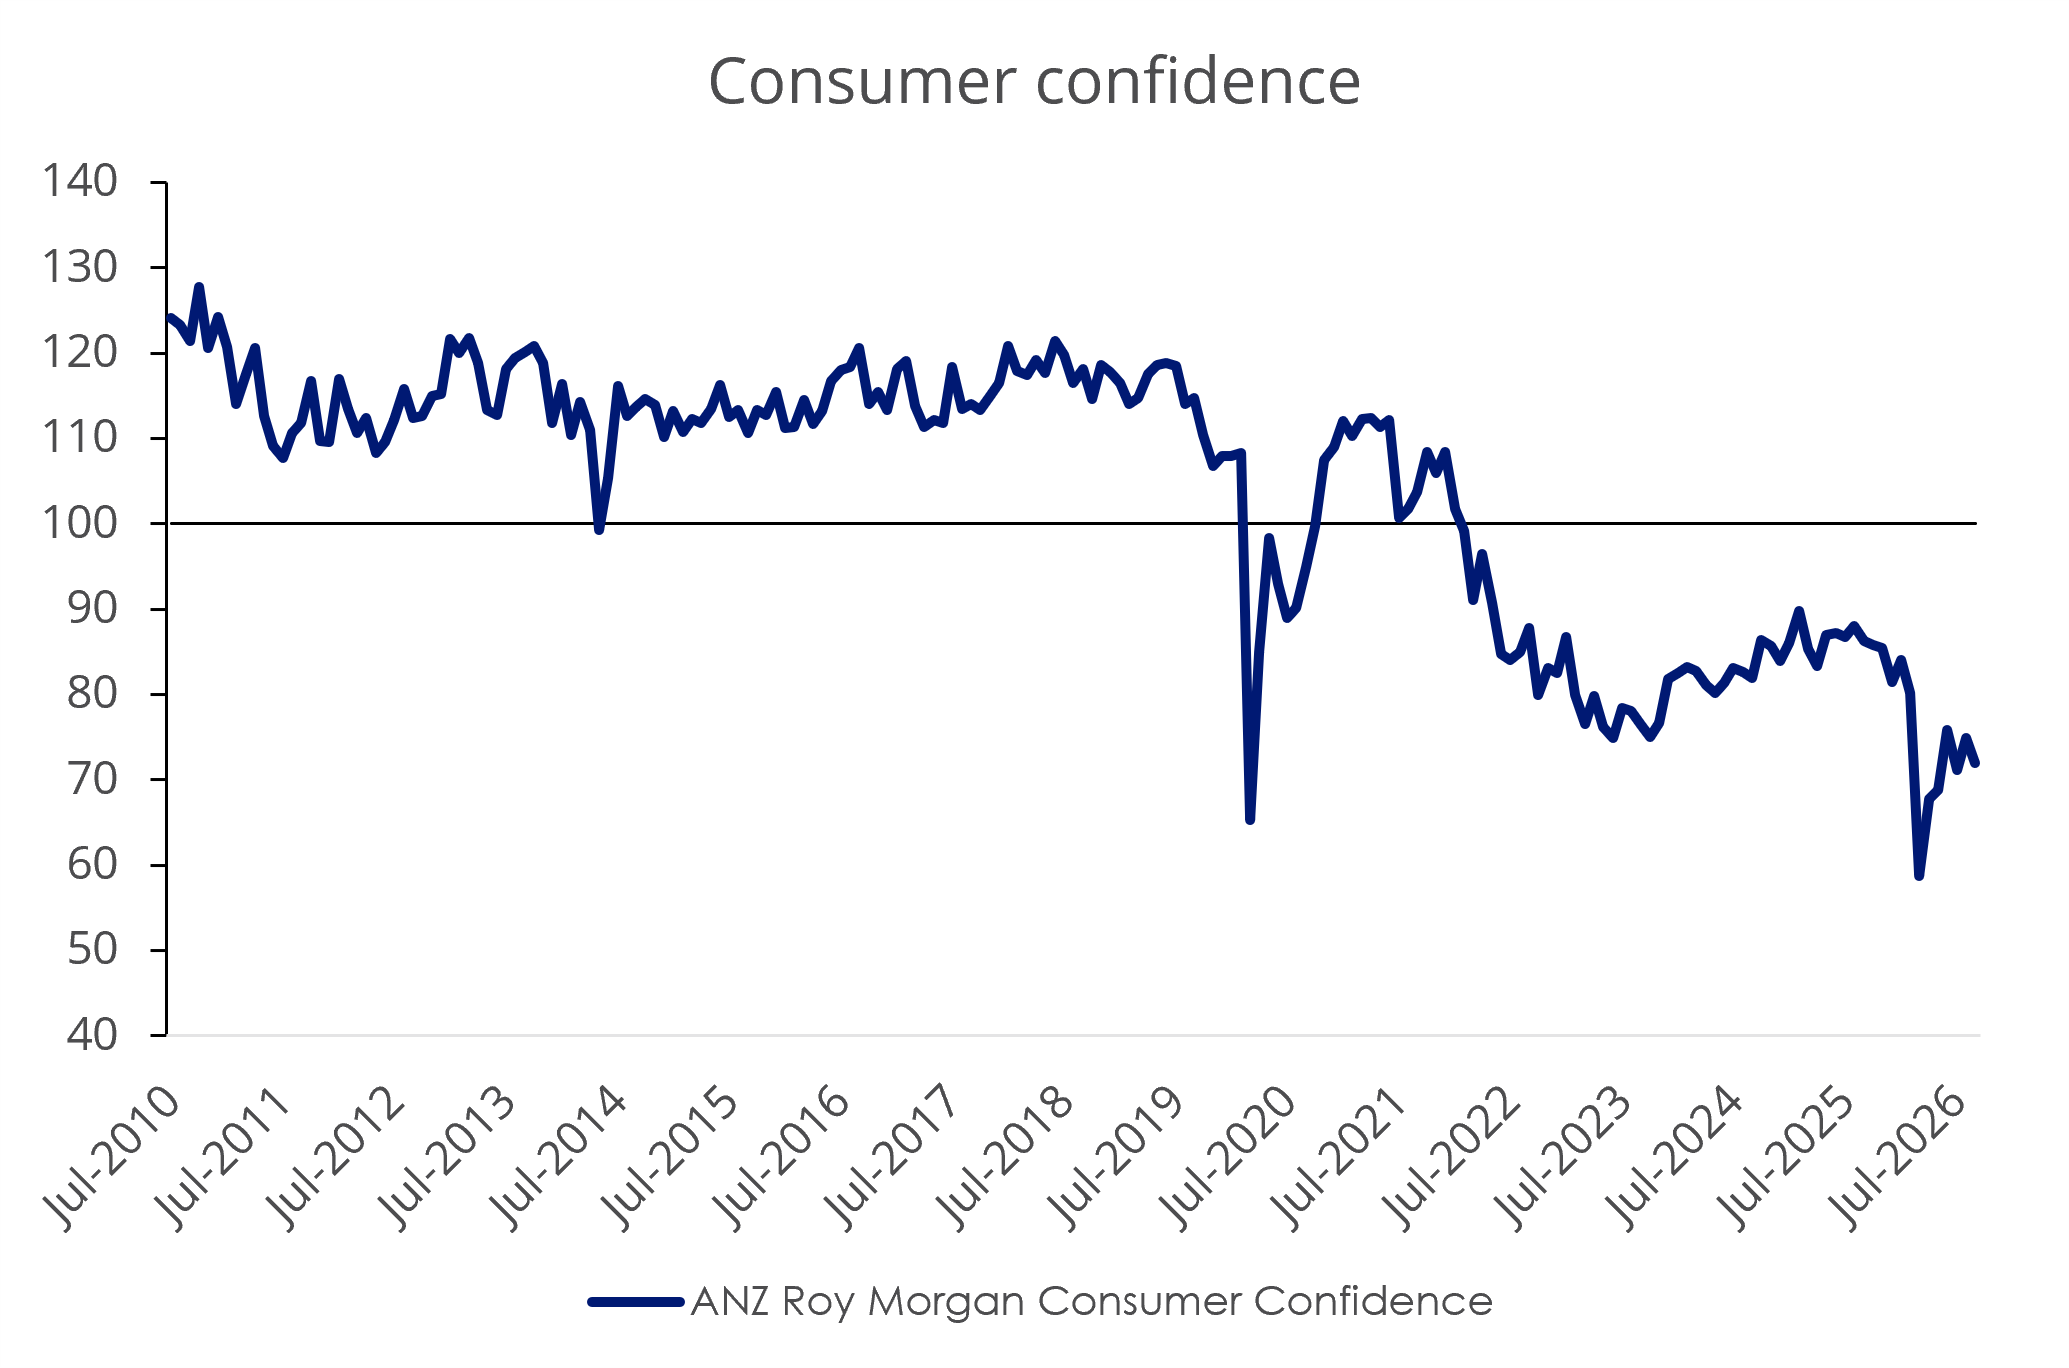
LHS: Source: NAB, Bloomberg. RHS: Source: ANZ, Bloomberg. As at 24 September 2026.
When economic conditions tighten, companies with superior stable returns on equity, a track record of durable earnings and lower debt-to-equity levels have tended to outperform during periods of economic stress. In many cases, these companies draw on advantages they had built through the good times, including scalable operations, a recurring customer base and pricing power.
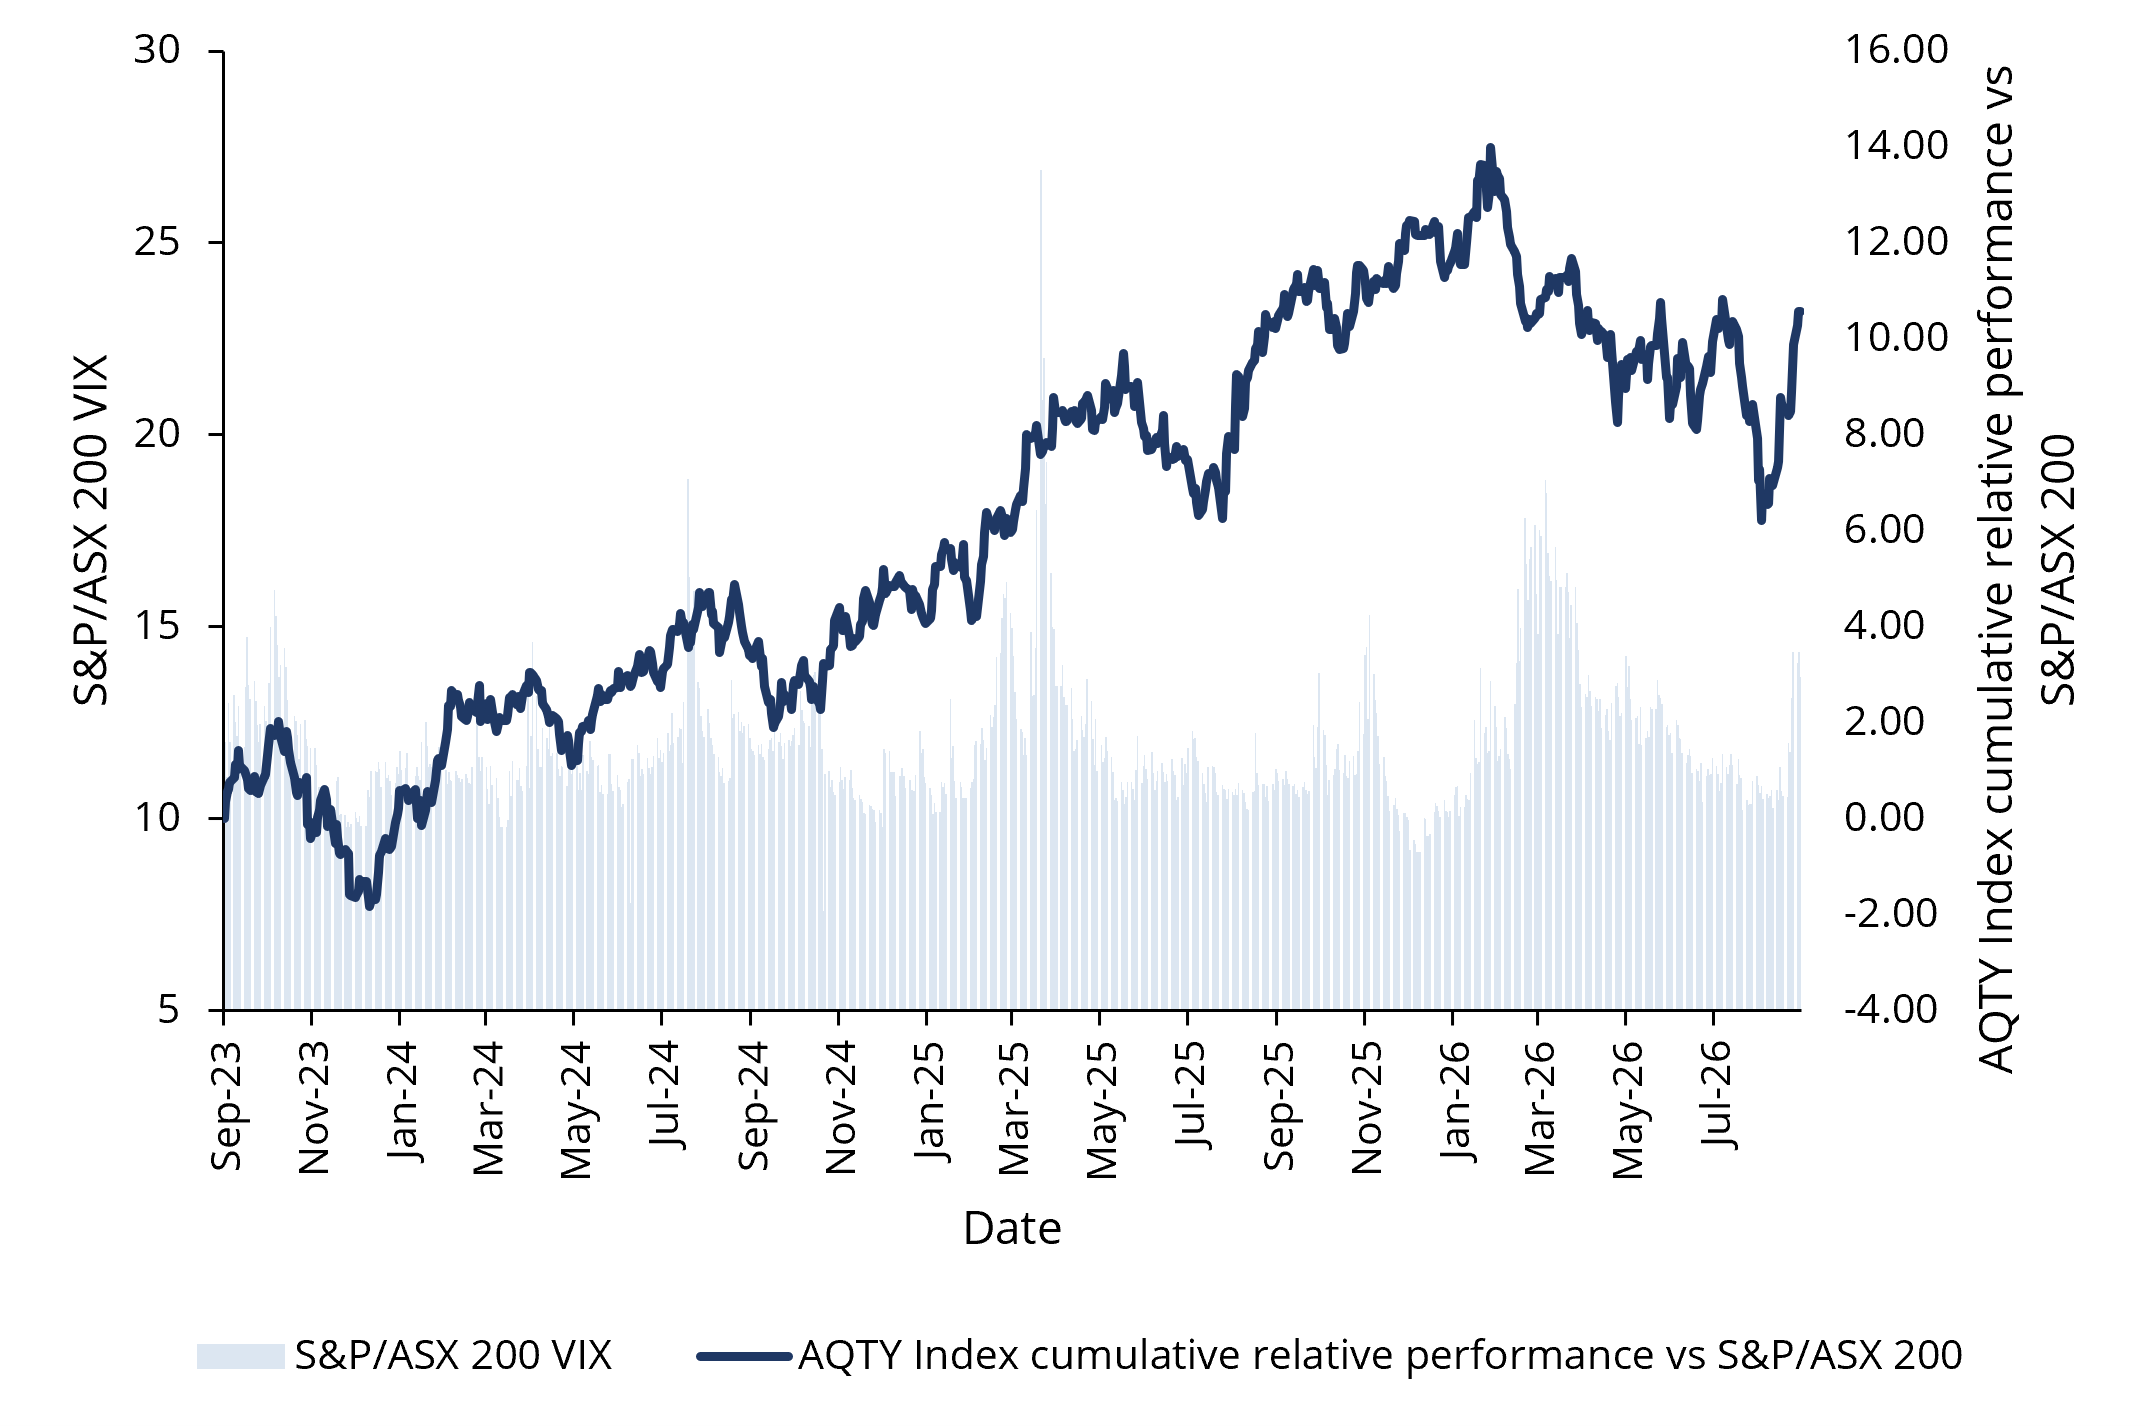
Periods of sharp rises in the S&P/ASX 200 VIX Index have often coincided with periods where quality companies, such as the ones held by the VanEck MSCI Australian Quality Plus ETF (AQTY), outperform the broader Australian share market.
Chart 4: The S&P/ASX 200 VIX Index vs MSCI Australia IMI Quality Plus Index (AQTY Index) over last 36 months
Source: Bloomberg, as at 16 September 2026. You cannot invest directly in an index. AQTY Index performance relative to S&P/ASX 200 Index. Performance shown is of the index, not of AQTY. Data prior to the live index launch date, 21 May 2026, is simulated based on the current methodology. Past performance is not indicative of future performance of the index or of AQTY. Results are calculated daily and assume immediate reinvestment of dividends. The S&P/ASX 200 Index is shown for comparison purposes as it is the widely recognised benchmark used to measure the performance of the broad Australian equities market.
From 31 August to 25 September 2026, AQTY has outperformed the S&P/ASX by 2.94%. And while one month does not establish a pattern, the longer record points in the right direction. Between March 2000 and August 2026, AQTY’s reference index outperformed in 66% of the 116 months when the market fell and in all five negative calendar years from 2001 to 2025. In other words, the Quality Plus methodology works as designed when it needs to as illustrated in the above chart.
Insuring a portfolio through troubled waters
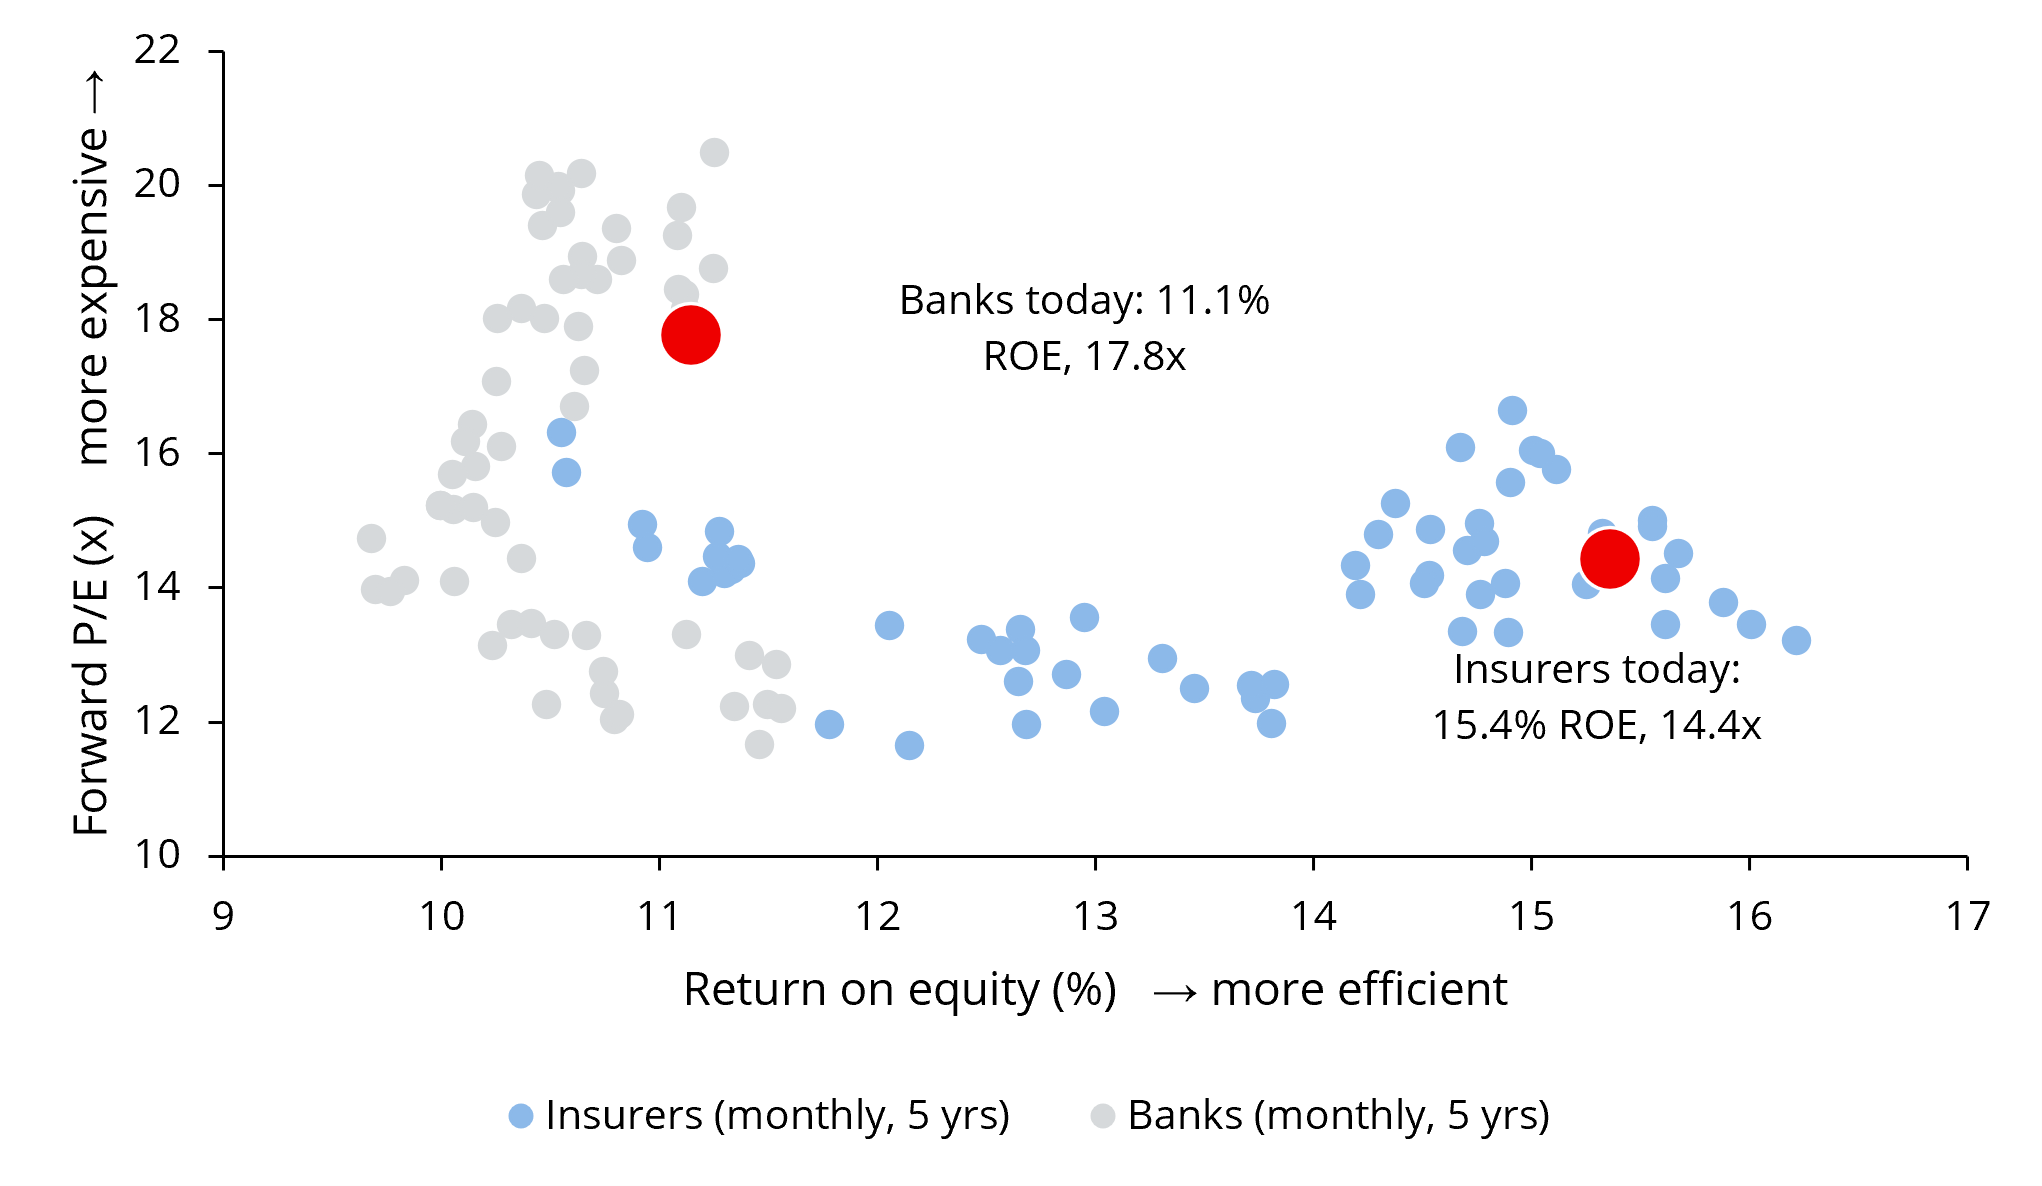
One area where AQTY is currently finding opportunity is insurance companies, which carry the largest overweight allocation (+5.5%). The sector currently generates a 15.4% return on equity while trading at 14.4 times forward earnings. For context, the banks sector generates a lower return on equity and commands a higher forward earnings multiple.
Chart 5: S&P/ASX 200 insurance companies vs banks
Source: Bloomberg, S&P/ASX 200 Insurance (AS51INSU Index) and S&P/ASX 200 Banks (AS51BANX Index), monthly P/E and ROE. Data as at 17 Sep 2026.
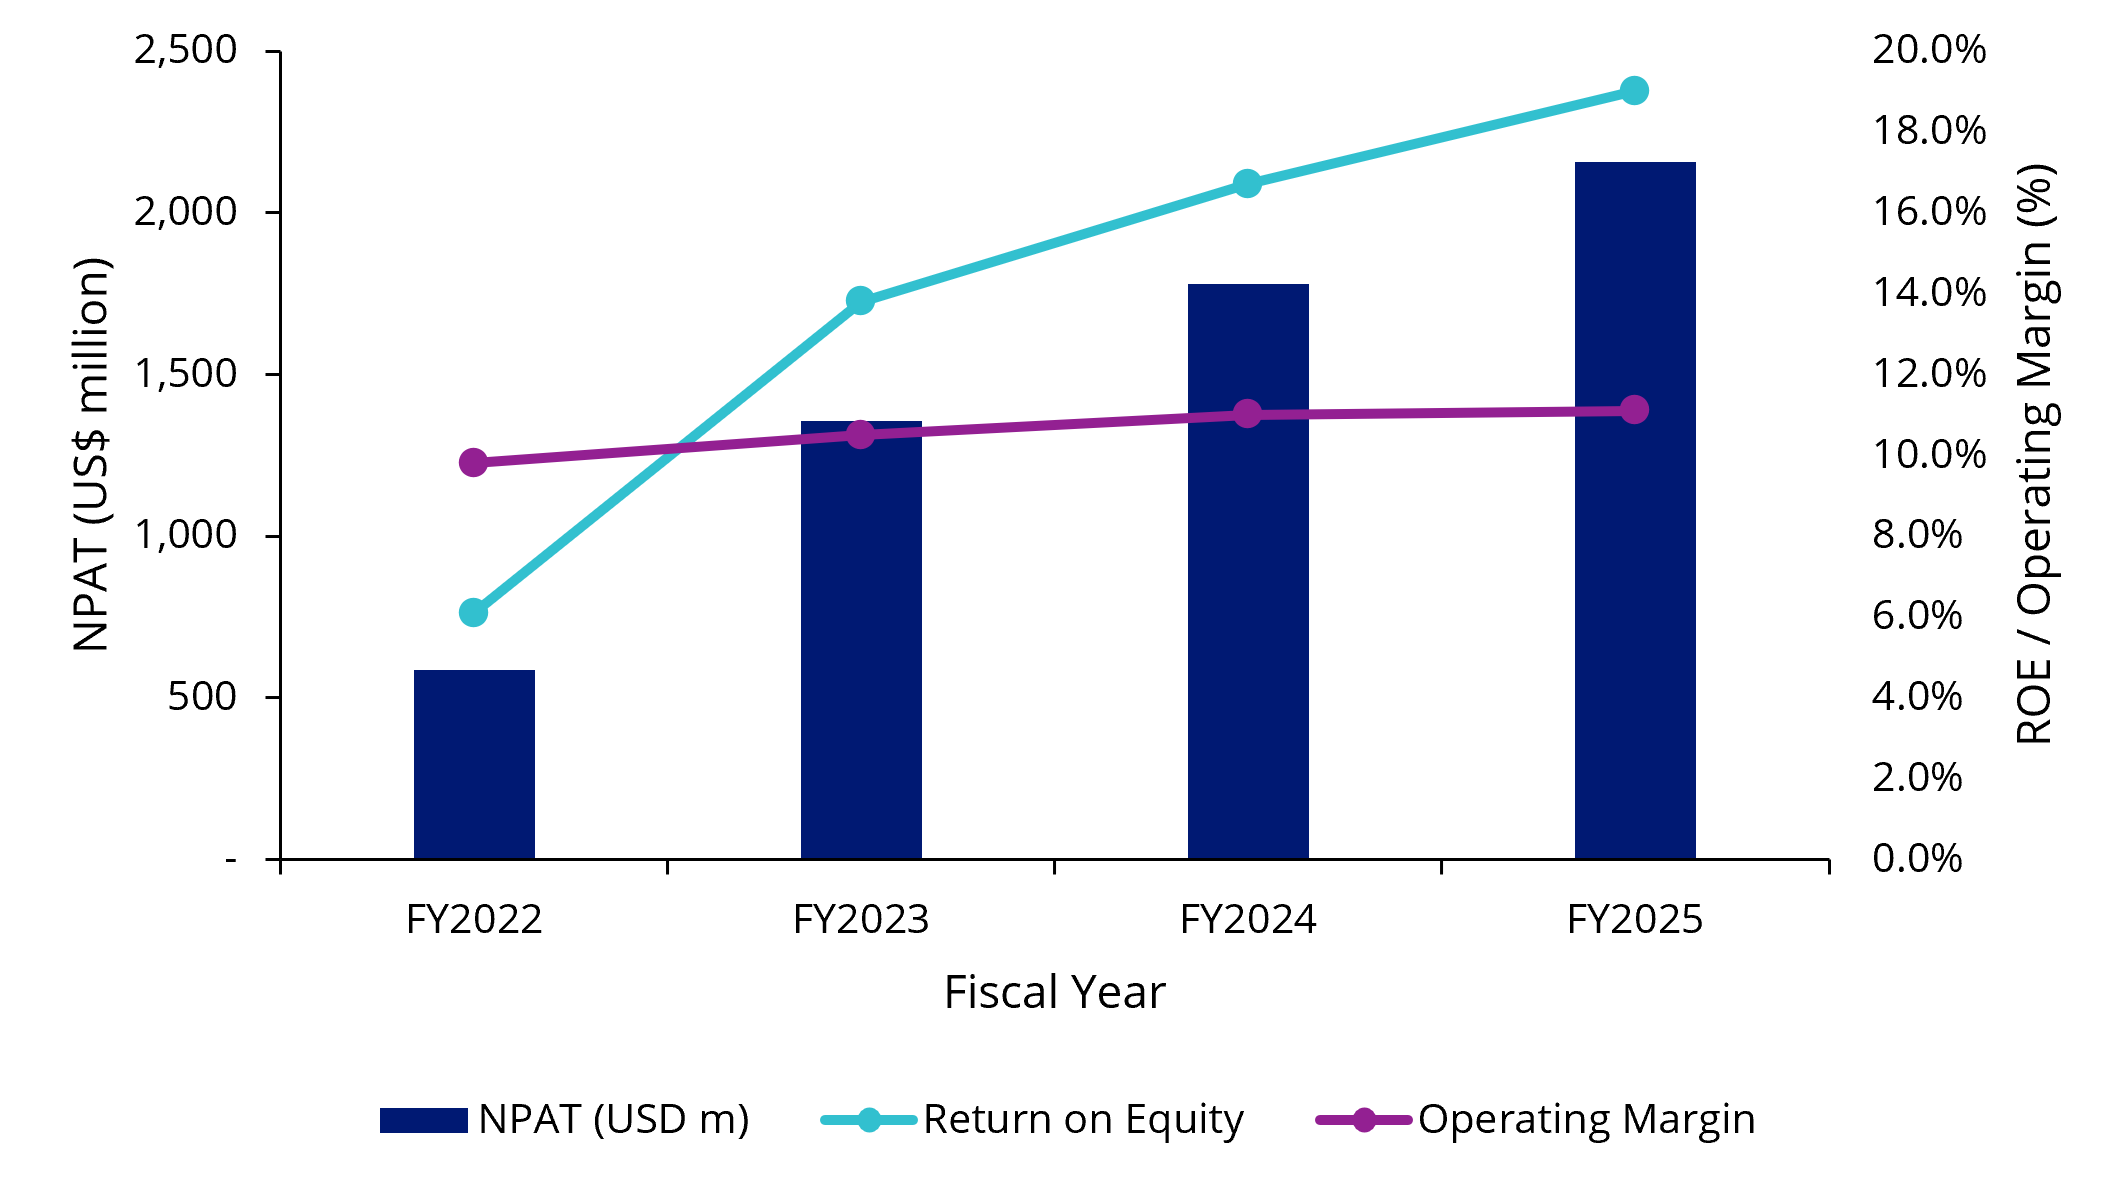
Within the insurance sector, QBE Insurance (ASX: QBE) provides a clear example of underwriting quality. For an insurer, growth creates value when premiums adequately compensate for claims, operating costs and the capital at risk. QBE’s latest half-year results suggest it has maintained that discipline: premiums grew while its combined operating ratio held at nearly 93%, meaning the group continued to write insurance at a profit rather than chasing growth through weaker pricing or risk selection.
That underwriting discipline supported an adjusted return on equity of 17.7%, comfortably above management’s own medium-term outlook. QBE also has an extensive global footprint, with 78% of its premiums written offshore. This geographical diversification helps it to reduce its dependence on conditions in any single market.
QBE is not immune to a difficult environment, but its underwriting discipline and capital strength leave it well placed to uphold earnings through one.
Chart 6: QBE Insurance’s NPAT, ROE and Operating Margin
Source: Bloomberg, as at 17 Sep 2026. Note that QBE Insurance reports its full year results in February unlike most other Australian companies.
Recurring earnings and operating leverage
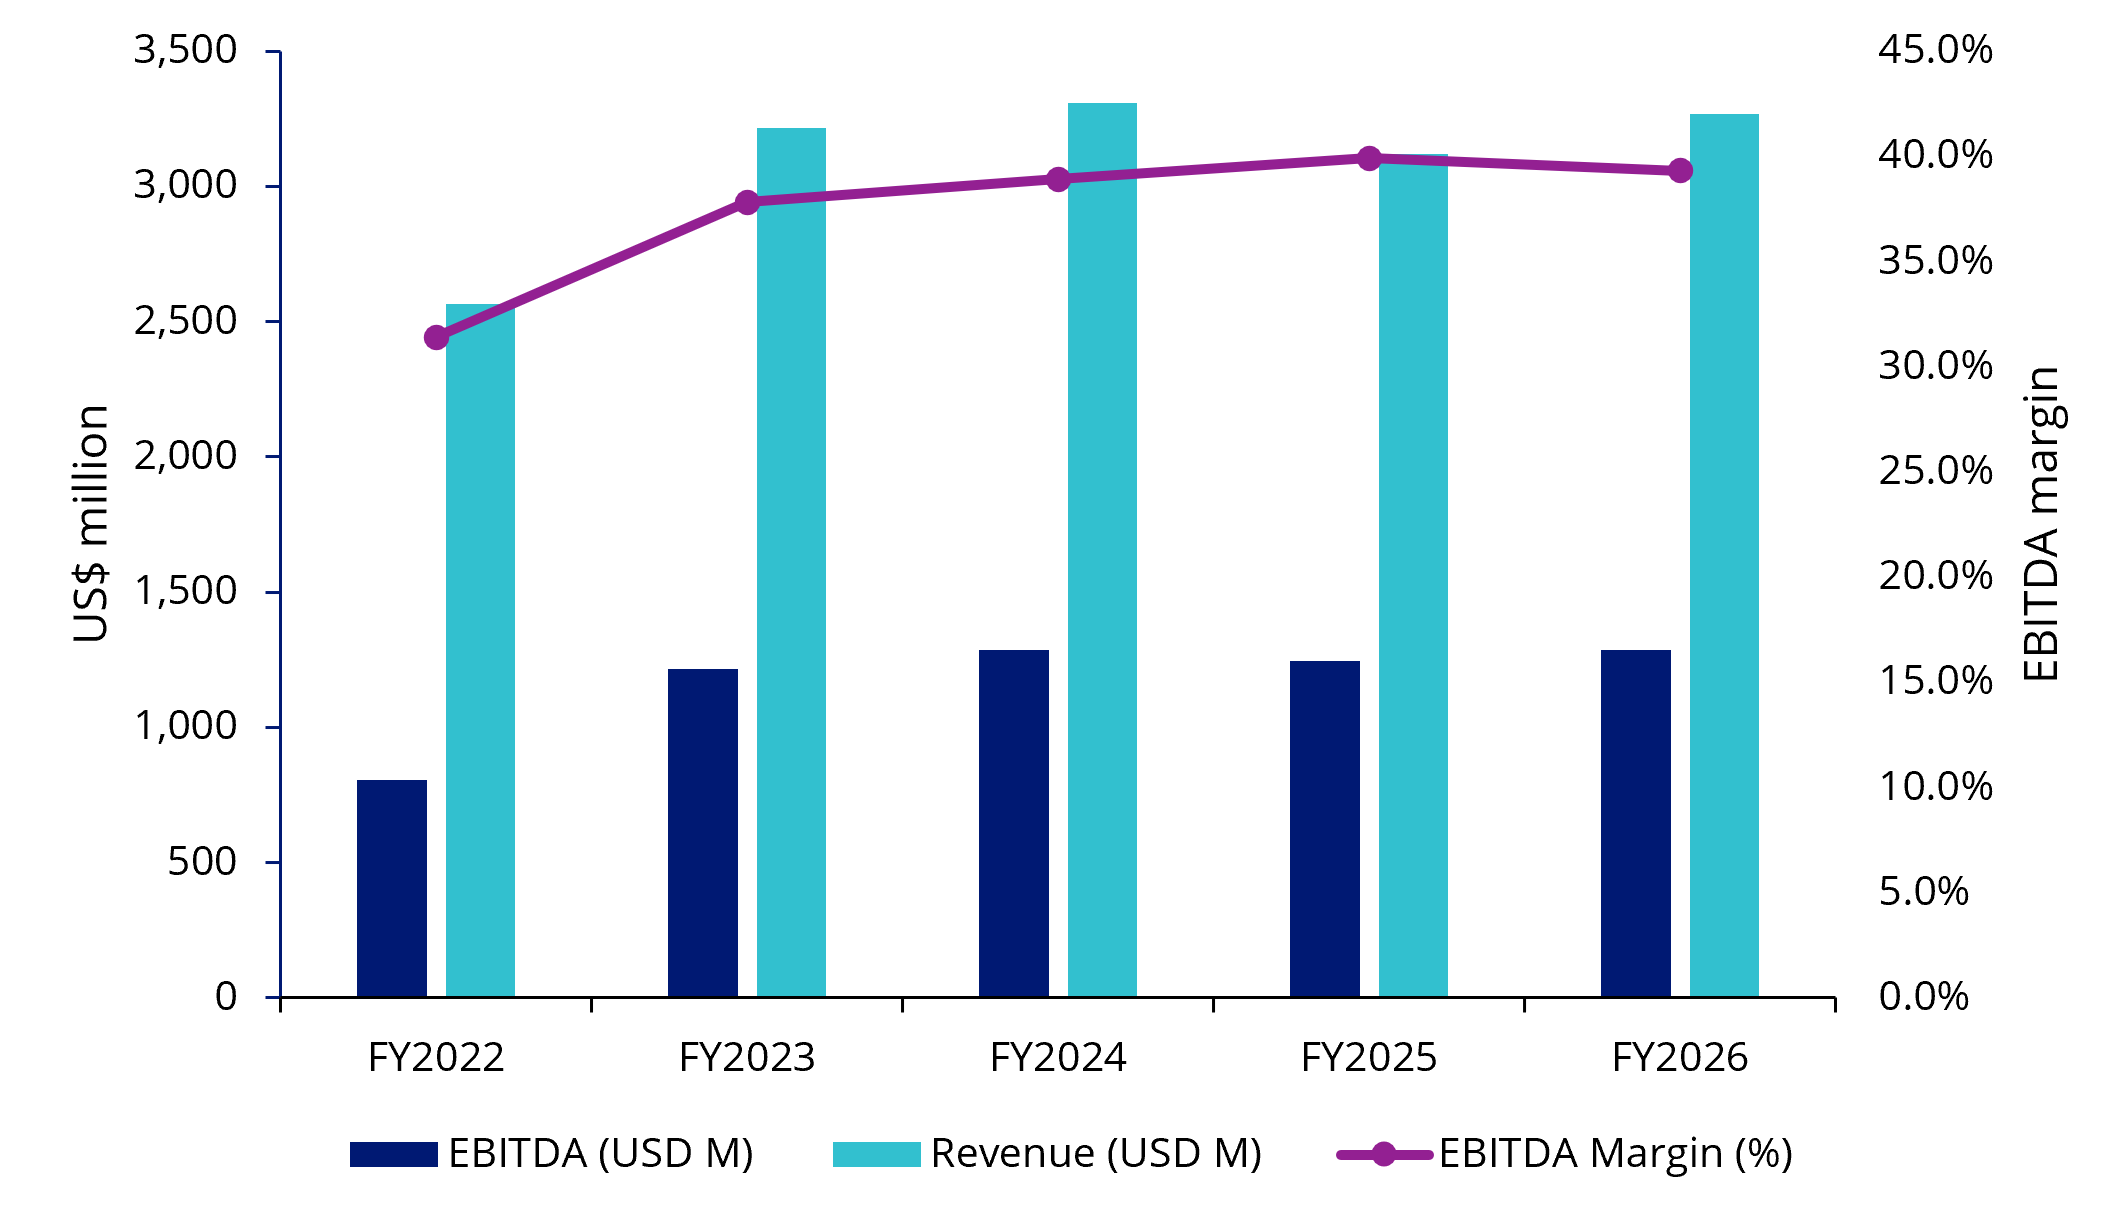
Computershare demonstrates the same quality outcome despite having a very different business model. Its share registry services are deeply embedded within clients’ operations, which helps the company earn recurring revenues as well as benefit from significant scale advantages and high switching costs.
These characteristics have supported a 171% increase in return on equity from FY22 through to the end of FY26 and a near-doubling in its operating margins to over 27%.
When inflation and volatility rise, predictable revenues and strong cash generation become more desired by investors. Computershare generated US$801 million in free cash flow, during fiscal 2026 while net debt-to-EBITDA declined to just 0.28 times.
All this means Computershare does not require perfect macro conditions to perform. Its recurring earnings, operating leverage and balance sheet flexibility allow it to keep executing when weaker businesses are forced to protect themselves.
Chart 7: Computershare revenue, EBITDA and EBITDA Margin
Source: Bloomberg as at 17 Sep 2026
Selectivity may define outcomes
QBE and Computershare occupy very different corners of the Australian market. But what ties them together is their ability to generate durable earnings, protect margins and maintain balance-sheet flexibility when the operating environment becomes less forgiving.
Quality investing does not remove volatility from a portfolio, nor does it mean every holding will outperform every day. But with inflation, rates and geopolitics pulling markets in several directions, owning quality companies can help increase the chance of an investor surviving a downturn in better shape than they may otherwise do.
Key risks
An investment in the ETF carries risks associated with: financial markets generally, individual company management, industry sectors, fund operations and tracking an index. See the PDS and TMD for more details.
AQTY is likely to be appropriate for a consumer who is seeking capital growth and a regular income distribution, is intending to use the product as a core, minor or satellite allocation within a portfolio, has an investment timeframe of at least 5 years, and has a high risk/return profile.


Published: 30 September 2026
Any views expressed are opinions of the author at the time of writing and is not a recommendation to act.
VanEck Investments Limited (ACN 146 596 116 AFSL 416755) (VanEck) is the issuer and responsible entity of all VanEck exchange traded funds (Funds) trading on the ASX. This information is general in nature and not personal advice, it does not take into account any person’s financial objectives, situation or needs. The product disclosure statement (PDS) and the target market determination (TMD) for all Funds are available at vaneck.com.au. You should consider whether or not an investment in any Fund is appropriate for you. Investments in a Fund involve risks associated with financial markets. These risks vary depending on a Fund’s investment objective. Refer to the applicable PDS and TMD for more details on risks. Investment returns and capital are not guaranteed.
VanEck MSCI Australian Quality Plus ETF (AQTY) is indexed to a MSCI index. AQTY is not sponsored, endorsed or promoted by MSCI, and MSCI bears no liability with respect to AQTY or the MSCI Index. The PDS contains a more detailed description of the limited relationship MSCI has with VanEck and the Fund.