Great expectations, fresh opportunities


AI’s profit challenge, China’s changing economy, gold miners’ margins and Australia’s rate outlook: nine charts on what matters for investors.
US$2 trillion buys a lot of data centres. Whether it buys enough investment value to match the lofty expectations of investors is another matter.
For all the many reasons to be excited about AI, investors cannot ignore the scale of the spending that will be needed to fund these ambitions. And all that money has to come from somewhere, meaning the world’s biggest companies are also now dipping their toes into the corporate bond market.
With governments continuing to borrow on a vast scale, competition for capital is pushing up its price at the fastest rate in decades. That changes the investment equation far beyond Silicon Valley, giving investors good reason to remain vigilant.
High hopes thin margins
At the outbreak of the Iran war, US 10-year bond yields squeezed modestly higher, from around 4% ahead of the war to around 4.25% six weeks later. No matter, said many of the deep thinkers, rates would need to hit 5% before they would trouble either the economy or equity market valuations.
At 5% bond yields, equity risk premium has vanished. And yet, despite these poor assessments from the market, US equities remain adjacent to all-time highs and most other major global markets, while off their immediate highs, remain above pre-conflict levels.
Chart 1: The case of the disappearing equity risk premium
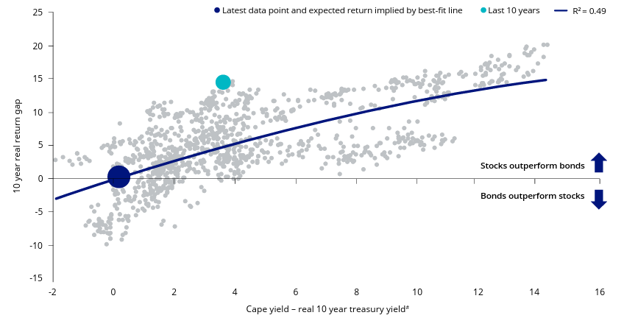
Source: Bloomberg, Finaeon, London Stock Exchange Group, 31 August 2026. Dots mark the latest data point and expected return implied by best fit line. *Relative return calculated by total return for S&P500 less return on 10-year treasury. #Real yield is spot yield less Cleveland Fed 10 year expected CPI, linked to trailing 5-year CPI.
Even if AI is genuinely transformative, the companies building the AI tools must be able to extract enough pricing power to pay a decent rate of return on the mind-boggling amounts of capex involved.
History is not supportive. Past similar booms, from fibre optics all the way back to electrification and railroads, tended to result in society-wide benefits (eventually) but usually resulted in the frontier businesses themselves mostly going broke first. Indeed, there are already straws in the wind for AI.
Chart 2: The sell-side forecast implies a poor payoff
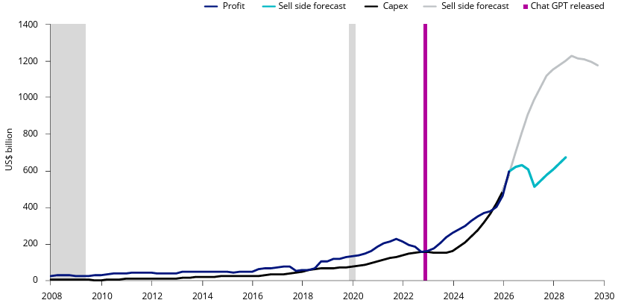
Source: Bloomberg, Institutional Brokers’ Estimate System/London Stock Exchange Group, National Bureau of Economic Research, August 2026. Shaded areas indicate recessions. Meta (from 2012), Alphabet, Oracle, Microsoft and Amazon.
More technically, sell side analysts’ forecasts seem to congregate around 10-year depreciation scales, while Nvidia seems to think its chips are outdated after three years. Someone is wrong. And the revenue required to close the gap is not small.
Bond markets appear alert to these risks, while equity markets seem to be less concerned. The cost of insuring hyperscaler debt against default is rising, even as comparable measures for government debt remain stable.
Chart 3: 5-year CDS spreads are starting to disconnect
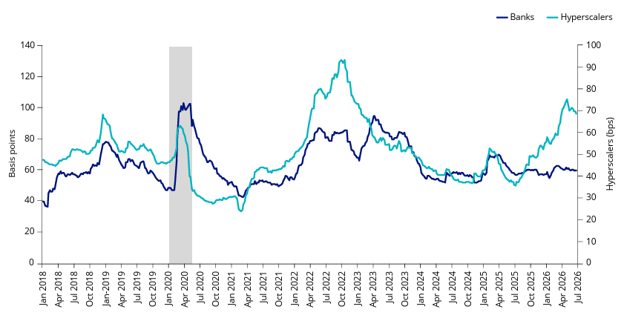
Source: Bloomberg as at 21 September. Banks include JP Morgan, Citi Group, Bank of America, Wells Fargo and US Bancorp. Hyperscalers include Amazon, Google, Microsoft and Oracle. Shaded area indicates recession.
Fiscal, monetary and politics
Indeed, the latest surge in US long rates occurred around the same time US government gross debt surged through US$40 trillion, or roughly 120% of GDP. With a budget deficit running at 6% of GDP, and no corrective policy in sight, this is unsustainable.
Note that this is with an economy basically at full employment. If the US hits a recession, for whatever reason, the deficit will soar, as tax payments decline and social security payouts rise.
Chart 4: US federal debt projected to get worse, not better
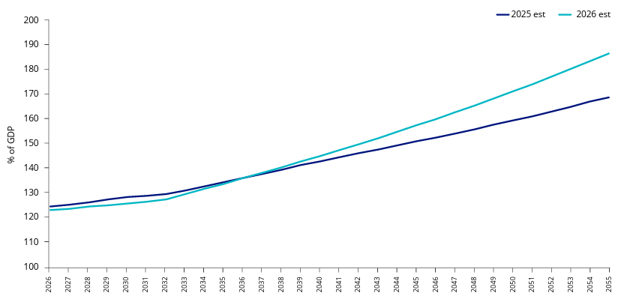
Source: Congressional Budget Office.
Meanwhile, as Japanese bond yields rise, it may not take much to trigger a substantial flow of capital back to Japan. A strengthening yen could prompt Japanese investors, from pension funds and insurers to households, to bring money home before currency movements erode the value of their overseas holdings.
As one of the two or three biggest sources of global funds, this could be problematic for global rates, especially with China substituting gold for US assets whenever possible.
Chart 5: The Japanese Yen is cheap
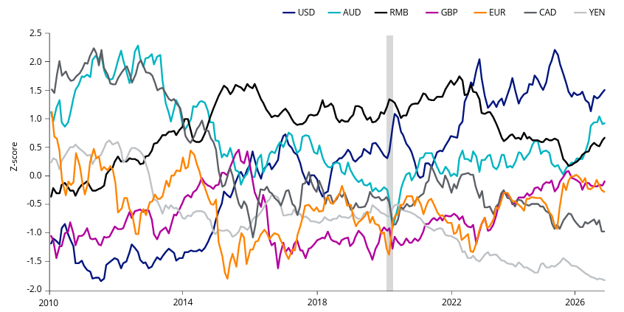
Source: Bank for International Settlements, National Bureau of Economic Research, 31 August 2026. Shaded area indicates a recession.
Another important policy signal came from the People’s Bank of China (PBoC), which confirmed that the authorities are willing to accept softer growth in pursuit of structural transformation. The PBoC Governor emphasised that this implies a fundamental shift in credit demand, including the fact that high-tech companies rely less on debt, and the end of massive credit expansion that had long been the fuel behind China’s growth engine.
Chart 6: New sectors continue to thrive in China
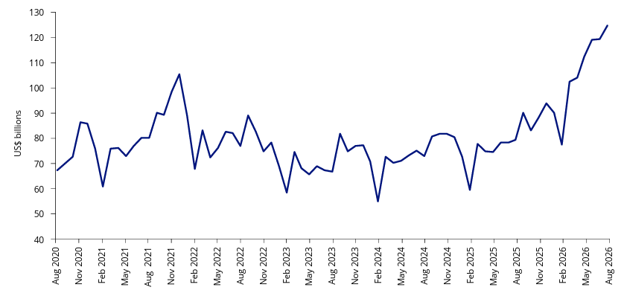
Source: Bloomberg, as at August 2026.
Winners are grinners
Emerging markets bonds keep beating developed market bonds, despite wars and despite global rates that are increasingly correlated. The asset built to absorb risk, US treasuries, hasn’t, and the one labelled riskier has.
Central banks have been diversifying into gold and “other” reserve assets, and emerging market local bonds are part of that demand. The result is lower volatility: Emerging market local bond volatility is currently below that of developed market sovereigns.
The other big risk is a US dollar rally, which would hit local currency returns. Both are real, but emerging markets’ lower debt and higher real rates give it more cushion than developed markets to absorb them.
Chart 7: Emerging market local bonds less volatile than developed market sovereigns
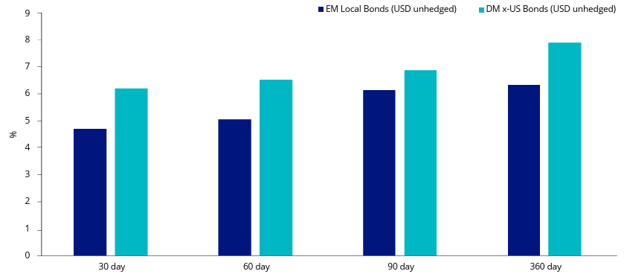
Source: Bloomberg, as at 29 September 2026. EM local bonds is J.P. Morgan Government Bond Index-Emerging Markets (GBI-EM). DM x-US Bonds is Bloomberg Global Treasury Large Markets DM ex US Index. Volatility measured as daily standard deviation of returns.
Gold beyond the ballot
In our view, the largest opportunity through year-end is continued investment demand for gold alongside a further re-rating of gold mining equities. The market’s focus on US debt, bringing greater attention to the country’s longer-term fiscal trajectory, potentially reinforces gold’s appeal as a hedge against fiscal, currency and financial-market risk.
For miners, strong gold prices relative to production costs continue to support historically elevated margins and free cash flow, allowing companies to strengthen balance sheets, return capital and fund growth while maintaining greater capital discipline.
Chart 8: At current gold prices, margins are strong
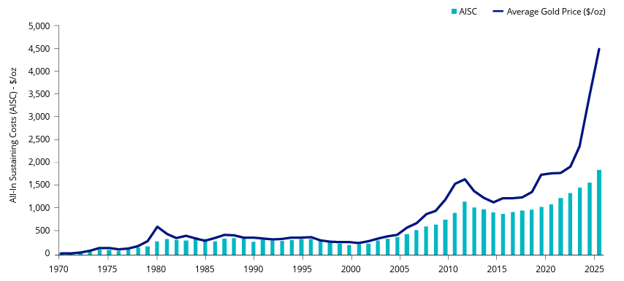
Source: Scotiabank, data as of June 2026.
Between rates and a hard place
Unemployment remains low and trimmed mean inflation refuses to budge from 3.6 per cent. Services inflation remains sticky and wage pressures continue to be exacerbated by the increase in the minimum wage by 6 per cent and award wages by 4.75 per cent. In our view the RBA may very well need to raise rates, not once but twice before the end of this year to tame inflation back to its 2 to 3 per cent target.
For investors, this is an environment in which equity market leadership may not stay narrow. Spreading exposure across a broader set we believe could be a sensible way to stay invested in Australian equities without doubling down on the Australian bourse’s most crowded corners. Seeking out those profitable companies with resilient fundamentals and the financial strength to withstand more difficult conditions could be prudent.
Chart 9: The RBA will be watching unemployment vs wages
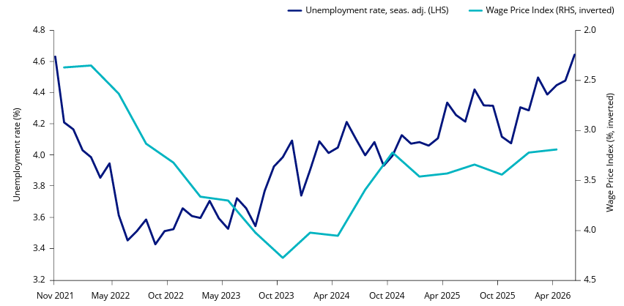
Source: Australian Bureau of Statistics, August 2026, unemployment seasonally adjusted monthly data, Wage Price Index quarterly data.
AI may change the world. It need not account for every good investment in it. From gold miners funding growth out of strong cash flows to China’s expanding high-tech sectors, there are other opportunities with numbers worth examining.
These are selected highlights from our latest VanEck ViewPoint. Read the full report for the analysis behind them.


Published: 11 October 2026
Any views expressed are opinions of the author at the time of writing and is not a recommendation to act.
VanEck Investments Limited (ACN 146 596 116 AFSL 416755) (VanEck) is the issuer and responsible entity of all VanEck exchange traded funds (Funds) trading on the ASX. This information is general in nature and not personal advice, it does not take into account any person’s financial objectives, situation or needs. The product disclosure statement (PDS) and the target market determination (TMD) for all Funds are available at vaneck.com.au. You should consider whether or not an investment in any Fund is appropriate for you. Investments in a Fund involve risks associated with financial markets. These risks vary depending on a Fund’s investment objective. Refer to the applicable PDS and TMD for more details on risks. Investment returns and capital are not guaranteed.