The proof is in quality’s pudding


There’s an old saying that the proof is in the pudding. The name of a dish can be appealing but it’s the taste that is king.
Plenty of funds promise a portfolio of quality companies, but not all of them take the same approach to identifying and investing in them. That may not matter when markets are moving higher in unison, but it does when investor sentiment has turned and quality stocks are demanded.
It all starts with Benjamin GrahamBenjamin Graham was writing about quality long before it appeared in an ETF’s name. In The Intelligent Investor, he argued that investors should demand “a sufficiently strong financial position and the potential that its earnings will at least be maintained over the years.” The principles of profitability, stable earnings and low leverage remain central to quality investing today.
We have written about these characteristics for many years, including as recently as last week using the current US earnings season as a barometer.
Borrowing can flatter a company’s return on equity and help it achieve its growth ambitions while a single profitable year may reflect favourable macro conditions. Looking at earnings over several years, alongside the debt that was required to generate them, gives investors a bigger track record by which to assess a company.
Although these principles are well established, quality funds differ in how they measure and combine them. MSCI gives equal importance to return on equity, earnings stability and low financial leverage, a combination its research found produced better historical results than using the measures alone. Other approaches add cash flow generation to their assessment, with an emphasis on finding companies that can sustain high returns on equity.
In our view, these differences deserve attention. Investors buying quality should compare what each approach has delivered, rather than assume the name tells them enough.
Not all quality is equalThe chart below compares QUAL with the MSCI World ex Australia Index since its inception, which we think captures an entire cycle. It has outperformed the benchmark index through that time. The performance is available - here.
QUAL has delivered outperformance through the cycle.
Chart 1: The proof of quality investing following its principles is in its results
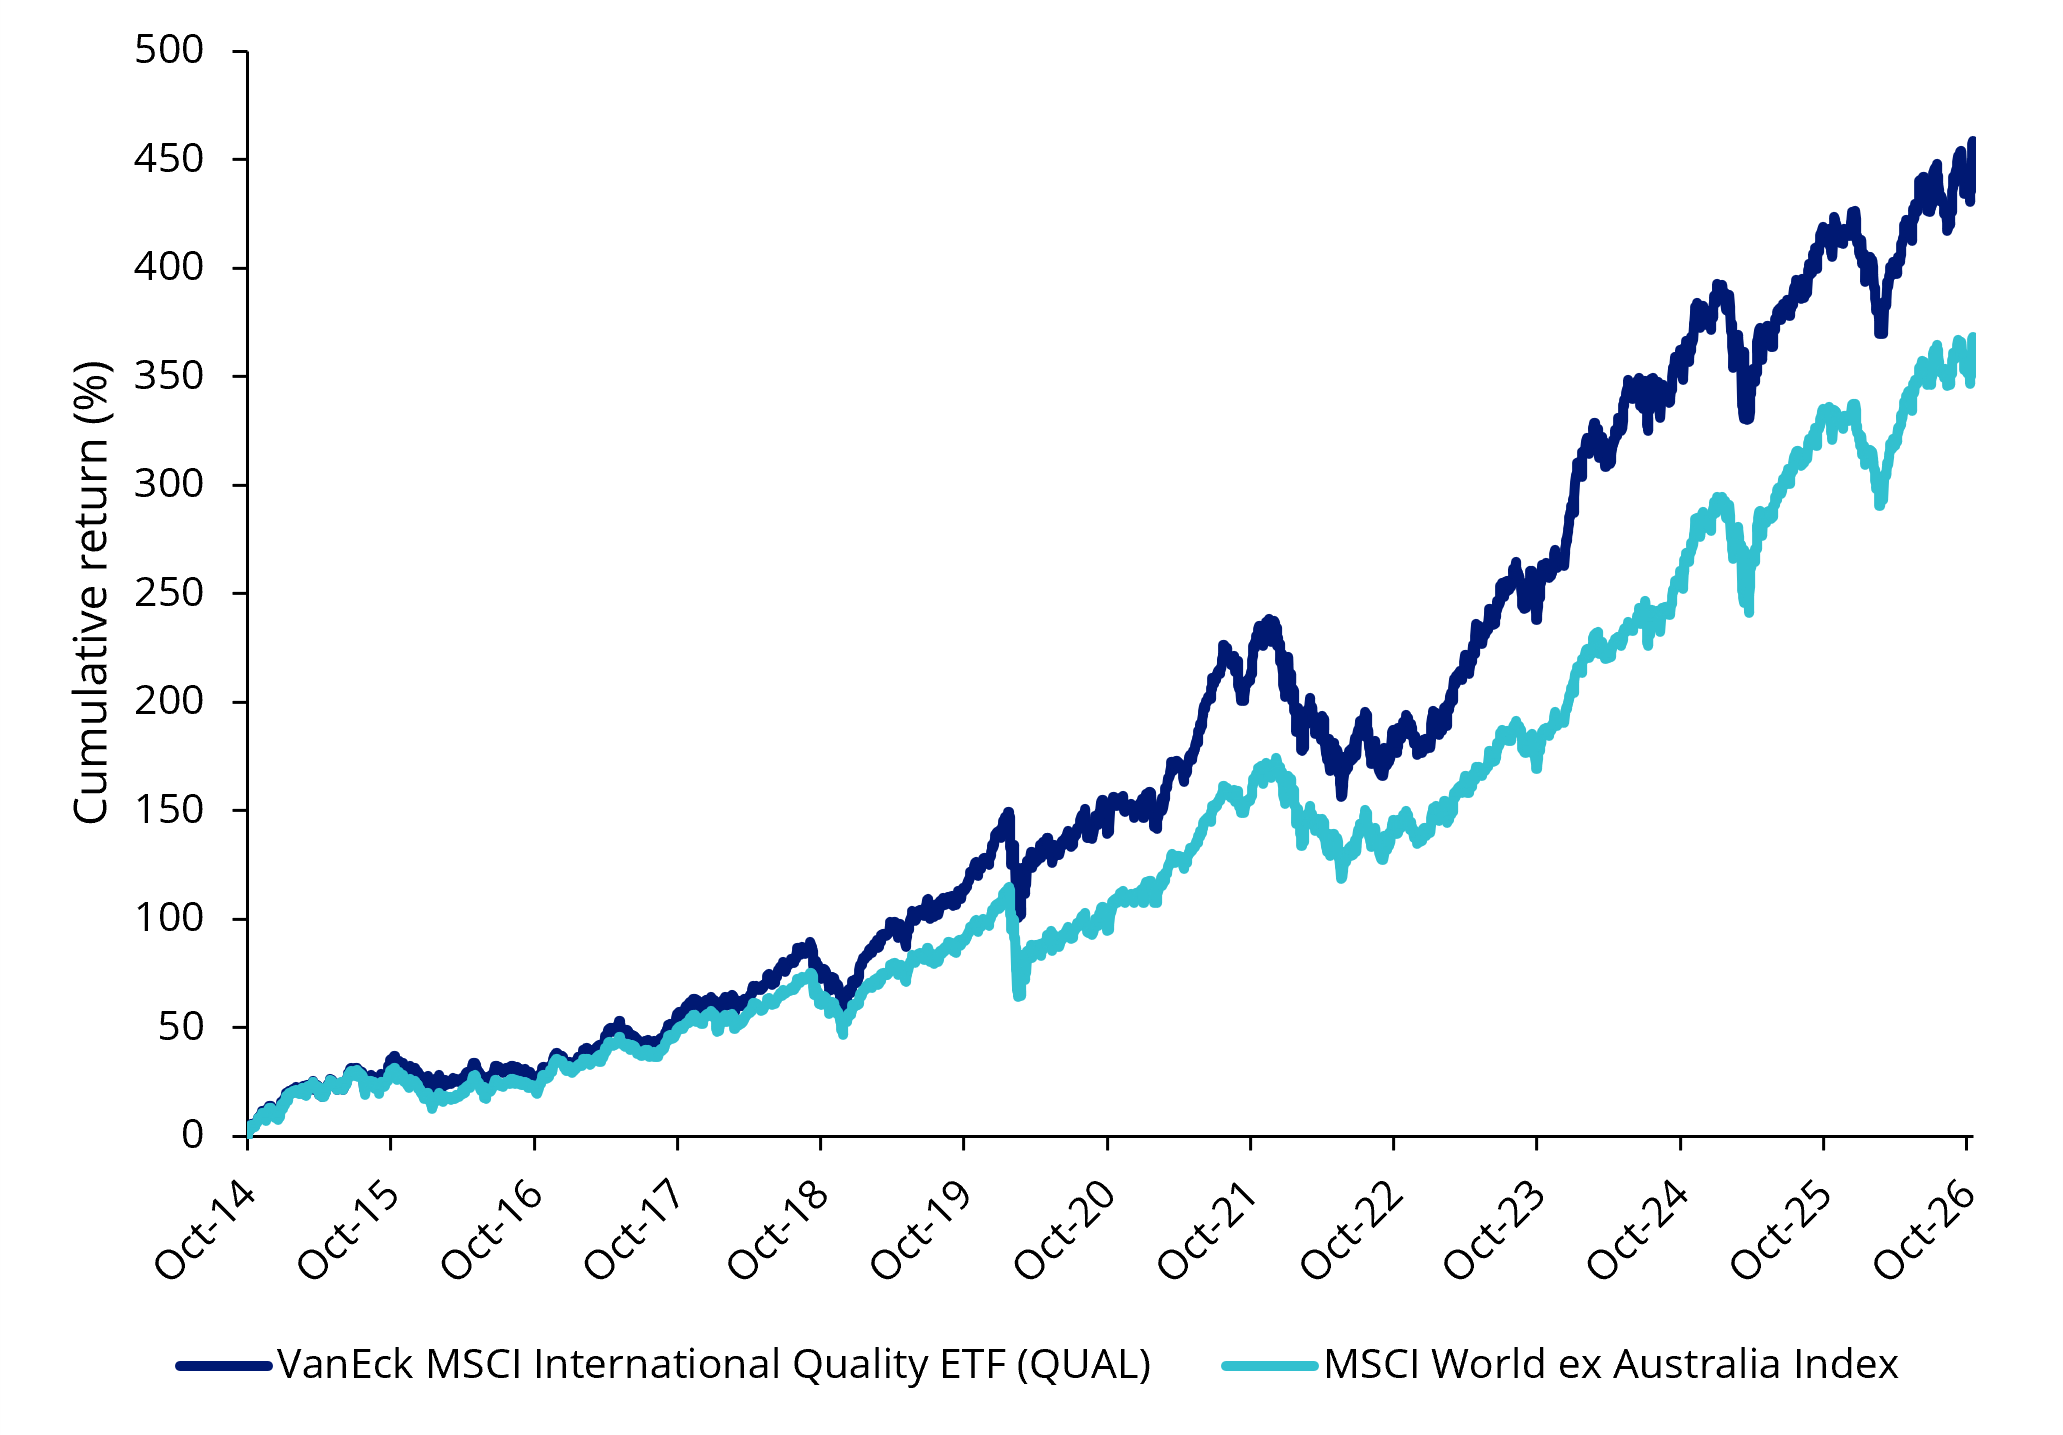
Source: Morningstar Direct. As at 6 November 2026. Past performance is not indicative of future performance. You cannot invest directly in an index. QUAL's inception date is 29 October 2014.
Quality should survive drawdownsTrue quality investing, in our view, is not just about delivering outperformance; it’s also about the potential for delivering smaller losses during market falls and deteriorating economic conditions.
Past episodes such as the dot-com collapse, global financial crisis and COVID-19 sell-off saw the international quality index fall less and recover sooner than the broader market.
The size of a fall matters because it determines how much an investment must gain to recover. A 20% loss requires a 25% gain to get back to the starting point; a 40% loss requires almost 67%.
The comparison below shows that the quality index that QUAL tracks, experienced a smaller maximum drawdown than the benchmark and recovered from its losses faster as well.
Table 1: Quality companies historically lose less and recover faster
| Quality Index (Maximum Drawdown) |
Benchmark (Maximum Drawdown) |
Relative recovery rate of Quality Index | |
|---|---|---|---|
| March 2000 - Dot-com bubble | -45.02% | -48.74% | 10 months faster |
| October 2007 - Stock market sell off | -21.95% | -34.93% | 9 months faster |
| August 2008 - Lehman Brothers filed for bankruptcy | -14.76% | -24.73% | 16 months faster |
| April 2010 - European sovereign debt crisis | -6.48% | -13.83% | 11 months faster |
| February 2020 - COVID-19 | -19.62% | -23.71% | 8 months faster |
Source: MSCI, VanEck, Morningstar Direct. Comparison of drawdown between the MSCI World ex Australia Quality Index (‘Quality Index’) versus the MSCI World ex Australia Index (‘Benchmark’). Maximum drawdown is the peak to trough decline from the start of the month specified to the recovery date, expressed as a percentage. The rate of recovery is the number of periods taken to recover from the trough to peak incline, it is shown here relative to the benchmark. The calculations for the above include the reinvestment of all dividends but do not include fees and other costs associated with an investment in QUAL. You cannot invest in an index. Past performance is not indicative of future performance of the index or QUAL.
Different approaches to selecting and weighting companies can produce different results over time, even if two funds claim to share a similar investment philosophy.
Finally, true quality, as represented by the index QUAL tracks, the MSCI World ex Australia Quality ETF has also outperformed during periods of increased volatility. In the five most recent periods of increased volatility (including the last week of October 2026 when the S&P 500 Volatility Index, or the VIX, rose 31% in a week), true quality outperformed the benchmark in each instance.
Chart 2: Relative performance of Quality vs VIX Index
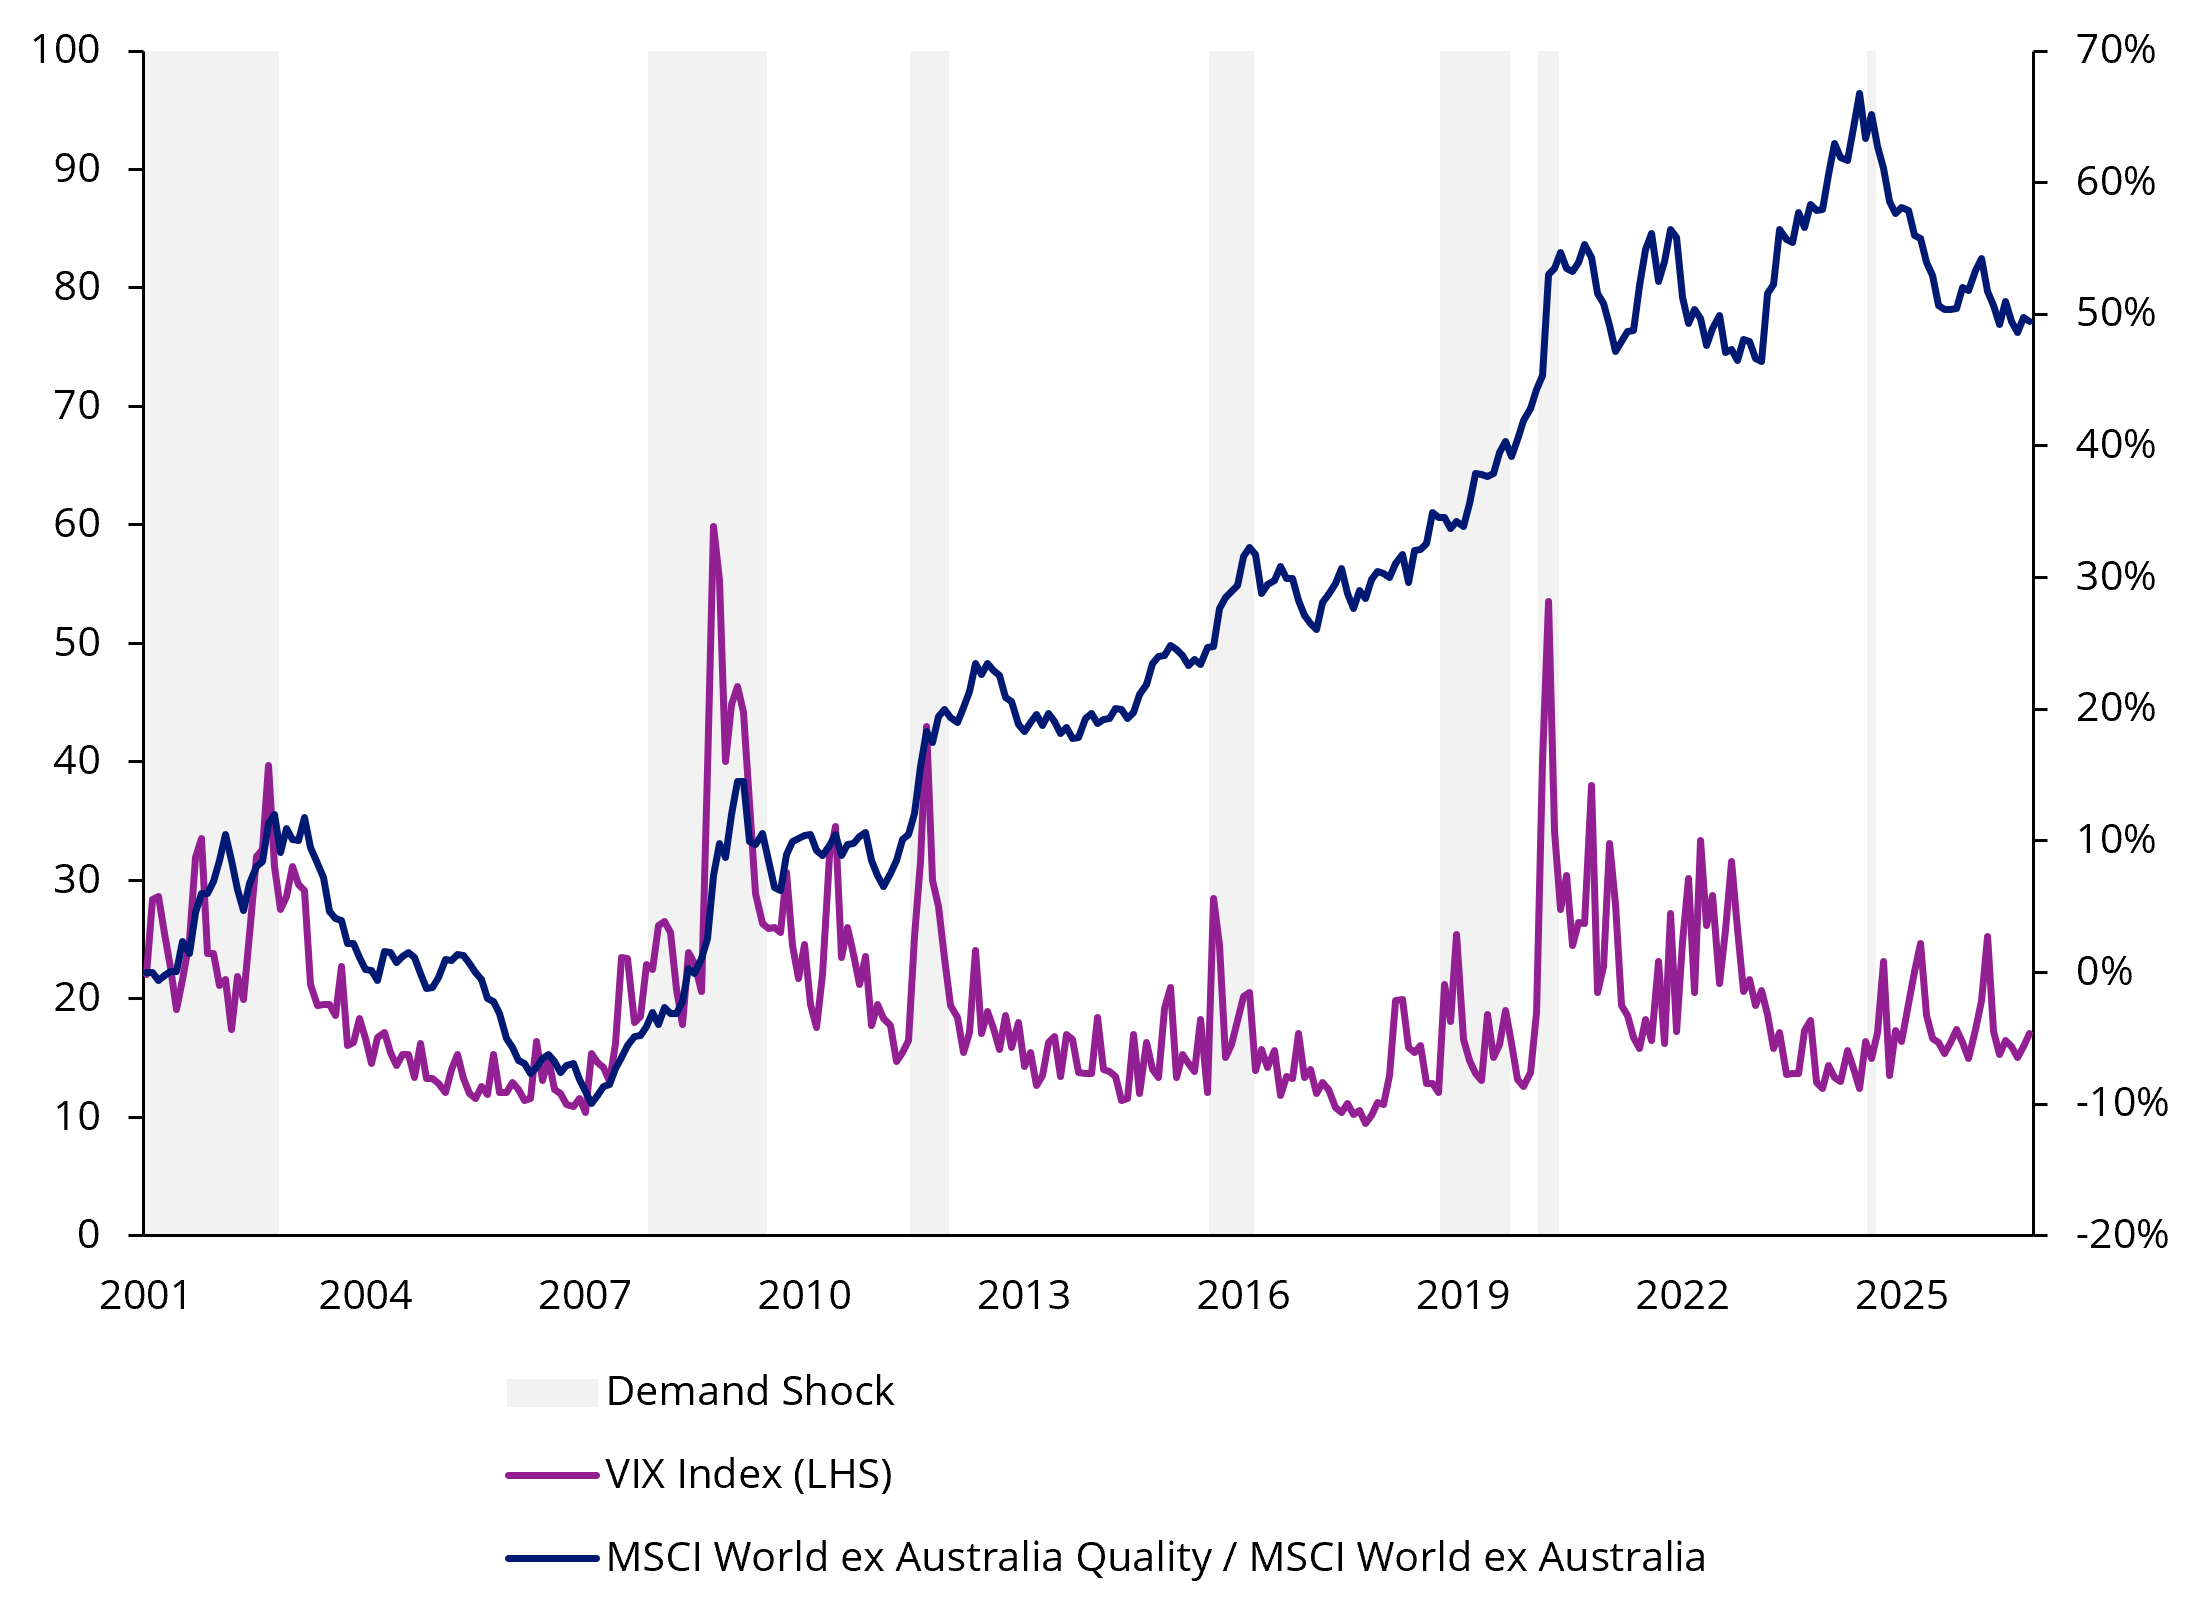
Source: MSCI Data/Calculations, Bloomberg, 29 January 1999 to 30 October 2026. Chart shows performance of MSCI World ex Australia Quality relative to MSCI World ex Australia compared to VIX Index. Results include the reinvestment of all dividends, but exclude fees and other costs associated with an investment in QUAL. You cannot invest in an index. Past performance is not indicative of future performance of the index or QUAL.
Quality’s historical appeal extends beyond periods of market stress. It is useful to understand how quality performs in other prevailing market conditions.
If we use the PMI index to measure the prevailing direction of economic trends in the manufacturing and service sectors we can measure and determine the state of the economy. The PMI measures the change in production levels across the economy, and it is considered a key indicator of its health. The chart below shows the three-month rolling PMI changes since 1998, highlighting the stage of the economic cycle at that time. The different colour dots represent the different economic conditions.
Chart 3: ISM Manufacturing Index
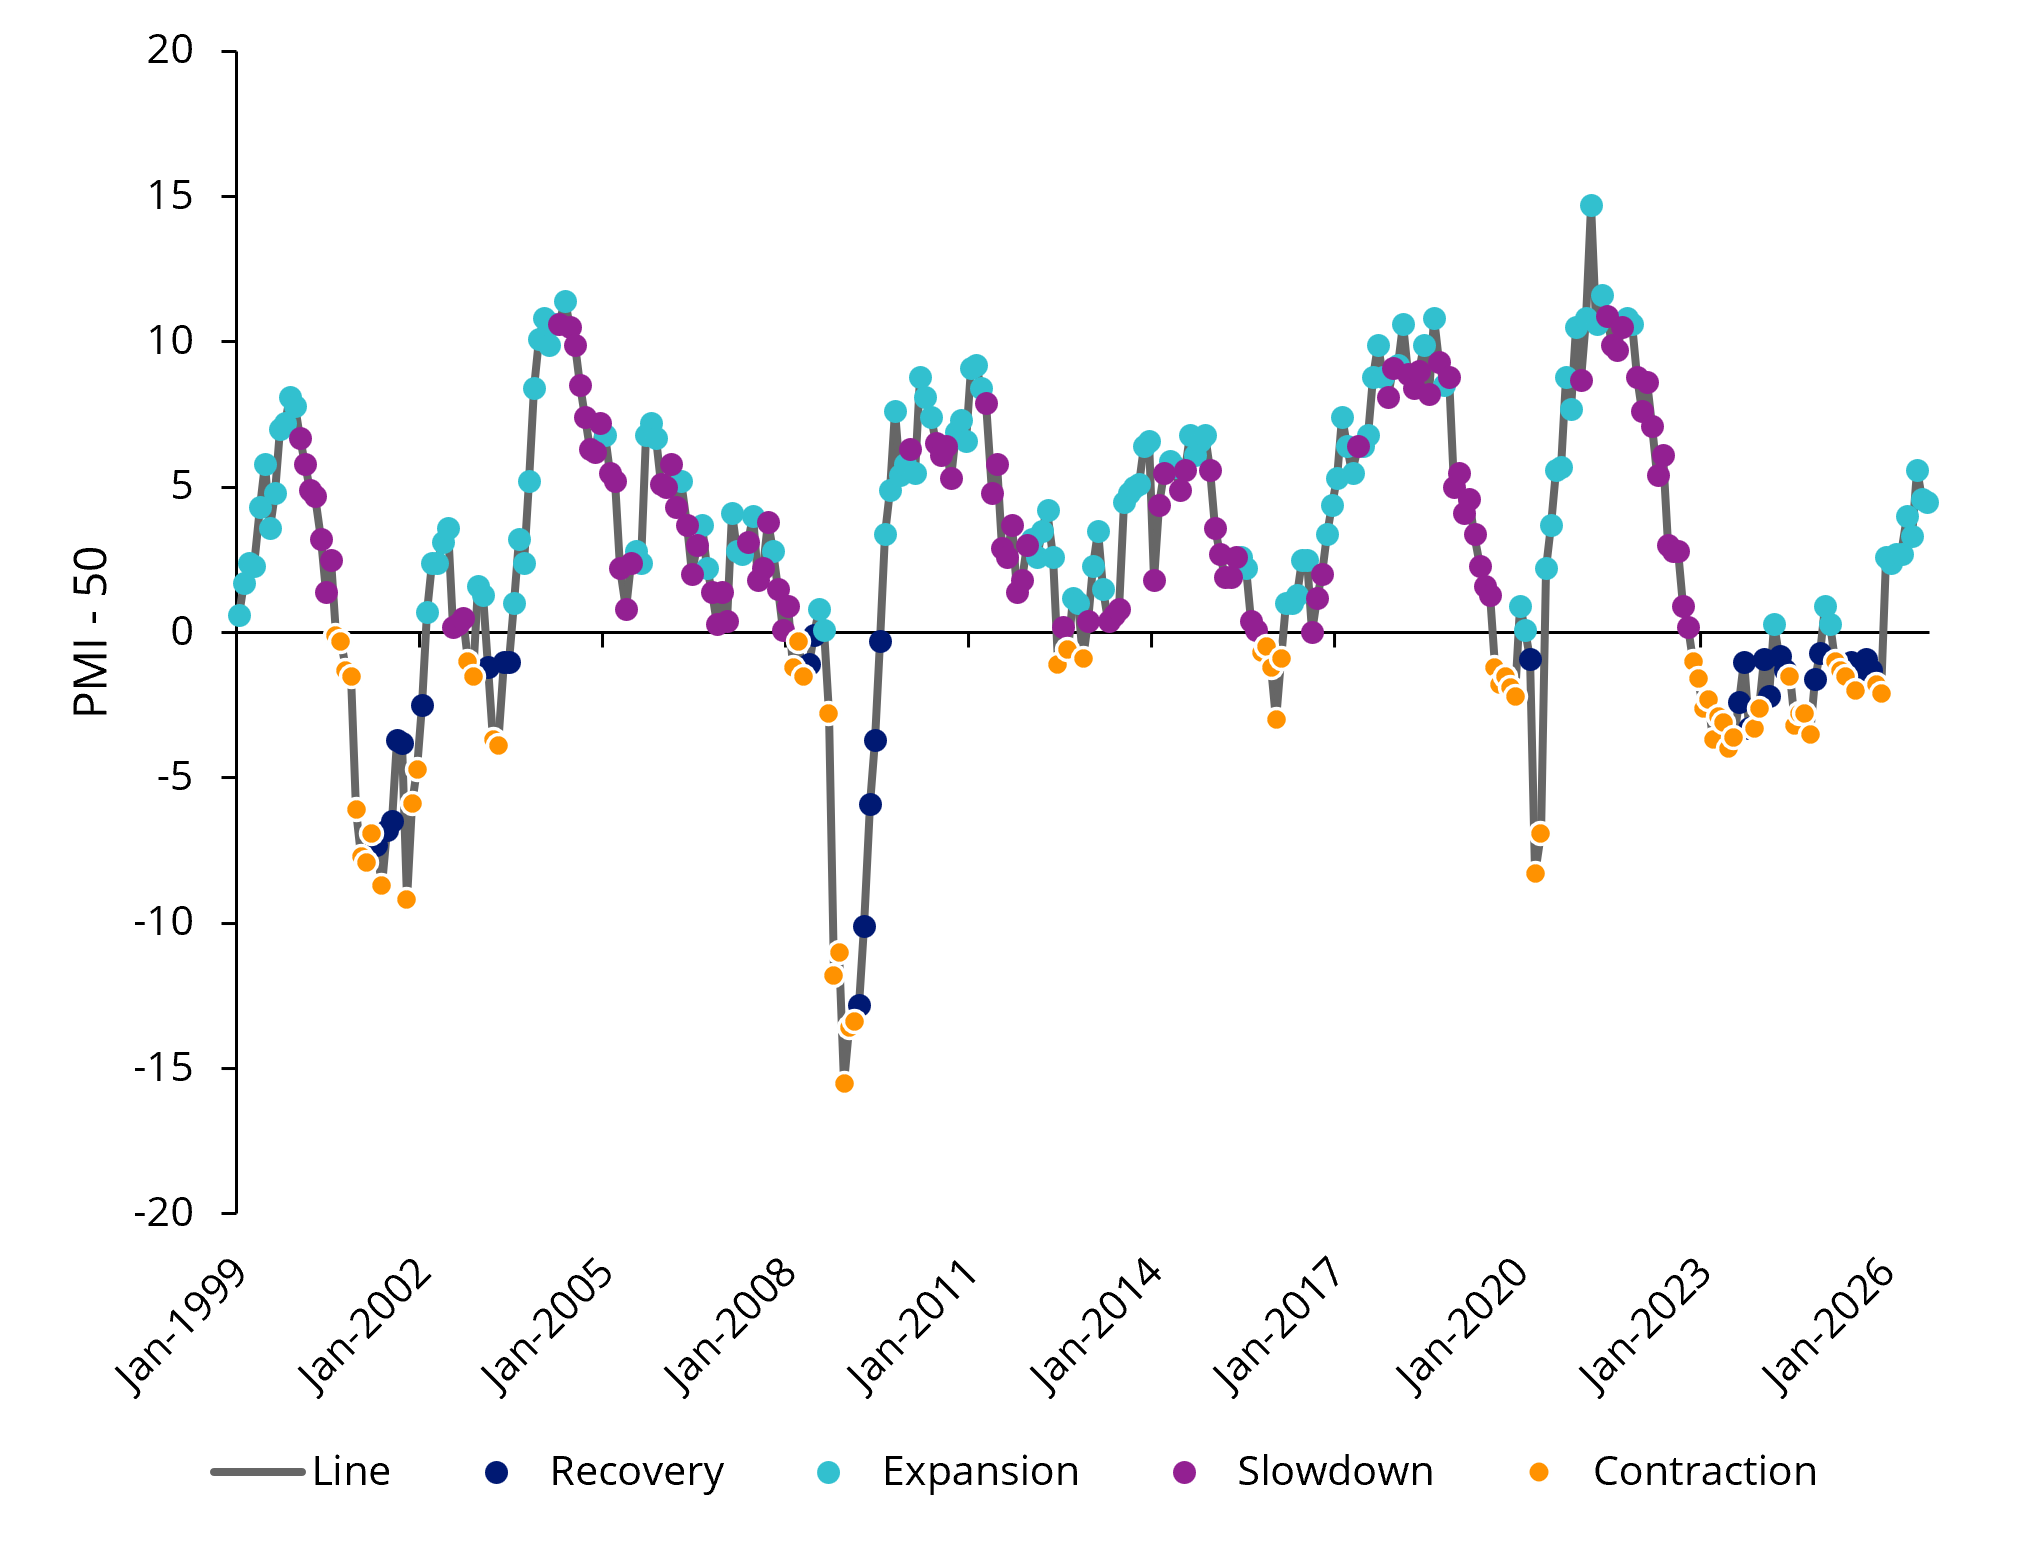
Source: Bloomberg, VanEck. As at 30 September 2026.
If we analyse the performance of a MSCI Quality Index across the different four economic phases, the quality index outperformed the broader market index during recoveries, slowdowns and contractions, lagging only slightly during expansions.
Table 2: Performance of Quality vs MSCI World Index
| Period | MSCI World | Quality |
|---|---|---|
| Recovery | 5.76% p.a. | 10.94% p.a. |
| Expansion | 16.51% p.a. | 15.14% p.a. |
| Slowdown | -1.70% p.a. | 0.38% p.a. |
| Contraction | 5.17% p.a. | 8.98% p.a. |
| Since November 1998 | 7.18% p.a. | 8.59% p.a. |
Source: Bloomberg, VanEck. As at 30 October 2026. You cannot invest in an index. Quality is MSCI World Quality Index. Results include the reinvestment of all dividends, but exclude fees and other costs associated with an investment in QUAL. Past performance is not indicative of future performance of the index or QUAL.
To capture true quality in the international equity universe with one trade on the ASX, the VanEck MSCI International Quality ETF (QUAL) is a portfolio solution that provides investors with exposure to around 300 quality companies across geographies and sectors. There is also an Australian dollar hedged version (QHAL), which investors can use to manage their desired currency exposure.
Funds carrying the quality label can deliver quite different outcomes. Investors deserve to know how quality is measured and what that discipline has delivered over time. The proof, we think, is in the results.
Key risks
An investment in the QUAL and QHAL carries risks associated with ASX trading time differences, financial markets generally, individual company management, industry sectors, foreign currency, currency hedging (QHAL), country or sector concentration, political, regulatory and tax risks, fund operations and tracking an index. See the PDS and TMD for details.
QUAL and QHAL are likely to be appropriate for a consumer who is seeking capital growth, is intending to use the product as a major, core, minor or satellite allocation within a portfolio, has an investment timeframe of at least 5 years, and has a high risk/return profile.


Published: 15 November 2026
Any views expressed are opinions of the author at the time of writing and is not a recommendation to act.
VanEck Investments Limited (ACN 146 596 116 AFSL 416755) (VanEck) is the issuer and responsible entity of all VanEck exchange traded funds (Funds) trading on the ASX. This information is general in nature and not personal advice, it does not take into account any person’s financial objectives, situation or needs. The product disclosure statement (PDS) and the target market determination (TMD) for all Funds are available at vaneck.com.au. You should consider whether or not an investment in any Fund is appropriate for you. Investments in a Fund involve risks associated with financial markets. These risks vary depending on a Fund’s investment objective. Refer to the applicable PDS and TMD for more details on risks. Investment returns and capital are not guaranteed.
QUAL and QHAL are indexed to a MSCI index. QUAL and QHAL are not sponsored, endorsed or promoted by MSCI, and MSCI bears no liability with respect to QUAL, QHAL or the MSCI Index. The PDS contains a more detailed description of the limited relationship MSCI has with VanEck and QUAL and QHAL.