When “cat”alysts chip in


Not all growth is worth owning. A company can deliver rapid sales and earnings growth yet disappoint investors if its share price already assumes too much.
That is why screening companies across several growth metrics and taking a diversified portfolio approach is prudent.
One year after its launch, the VanEck MSCI International Growth ETF (GWTH) provides a live test of whether a systematic, rules-based approach can compete with established active growth managers.
One year on
GWTH’s results show how funds carrying the same growth label can deliver very different outcomes.
From GWTH’s inception to 23 September 2026, the fund delivered an annualised return of 7.87%. That was more than three times the return of the next-best selected manager, while three of the four active funds went backwards. GWTH also led the selected actively managed growth funds year to date and achieved this performance without experiencing the group’s largest drawdown.
Table 1: GWTH’s performance versus selected global growth funds
| Performance year to date (%) | Performance from GWTH inception to 23 September 2026 (% p.a.) | Drawdown from GWTH inception to 23 September 2026 (%) | |
| GWTH | 8.18 | 7.87 | -20.78 |
| Growth manager 1 | 0.52 | 2.04 | -16.39 |
| Growth manager 2 | 0.40 | -2.64 | -28.70 |
| Growth manager 3 | -11.92 | -22.19 | -40.56 |
| Growth manager 4 | -13.39 | -15.41 | -28.70 |
Source: Morningstar Direct. Performance and drawdown data as at 23 September 2026. GWTH inception date is 26 August 2025. This is a short performance period and past performance is not indicative of future performance. Results are net of management fees and assume the immediate reinvestment of dividends. YTD returns are cumulative, returns exceeding one year are annualised. Growth managers 1–4 are selected actively managed global equity growth funds typically considered peers of GWTH. A copy of GWTH factsheet is available here.
Active growth meets its match
GWTH’s first year shows that a systematic, rules-based investment process can compete with established active managers at a fraction of the typical active management fee.
The strategy assesses about 1,200 international companies against five measures covering long and short term forward EPS growth, historical EPS growth, internal growth and sales growth. This allows companies to be screened across short-term and long-term fundamentals. A momentum screen then tests whether the market is recognising those fundamentals. Around 100 companies make the final portfolio.
This produces an exposure that looks different from the broader international share market. As at 31 August 2026, companies in the MSCI World ex Australia Growth Select Index had delivered stronger historical sales and EPS growth, as well as higher expected EPS growth, than the MSCI World ex Australia Index. Notably, as at writing, none of the Magnificent Seven are among GWTH’s top 10 holdings – you can view GWTH’s holdings here.
Table 2: GWTH Index’s key statistics vs global equities
| GWTH Index | MSCI World ex Australia Index | |
| Historical three-year EPS growth | 46.56 | 25.94 |
| Historical three-year sales growth | 20.57 | 14.33 |
| Short term forward EPS growth | 29.65 | 17.09 |
| Long term forward EPS growth | 35.29 | 21.66 |
| Forward P/E ratio | 24.33 | 18.55 |
Source: FactSet, MSCI, VanEck, as at 31 August 2026. You cannot invest in an index.
The portfolio trades at a premium to global equities, as investors would expect from a growth strategy. But the distinction is that GWTH seeks companies whose underlying sales and EPS growth can support that premium.
Growth can clear a higher hurdle
While it is true that growth investments tend to be cyclical, the reason rates are elevated matters just as much.
Oil prices remain high, but markets are beginning to treat elevated energy costs as part of the economic baseline rather than a fresh shock each day. If volatility stays contained while EPS growth accelerates and reaches more sectors, companies producing superior growth can continue to reward investors.
Manufacturing activity helps distinguish between these environments. Our analysis shows that the growth factor produced excess returns of 6.37% during expansions versus the benchmark MSCI World Index.
Table 3: How factors perform in different parts of the economic cycle
| Period | Quality | Growth | Enhanced Value |
| Recovery | 5.19% | 5.40% | 4.71% |
| Expansion | 1.46% | 6.37% | 5.74% |
| Slowdown | 2.08% | 3.44% | 0.83% |
| Contraction | 3.80% | -7.55% | 0.73% |
| Since Inception | 1.70% | 2.08% | 1.66% |
Source: VanEck, Bloomberg. Data runs 31 December 2000 to 31 December 2025. Growth is MSCI World Growth Index, Enhanced Value is MSCI World ex Australia Enhanced Value Top 250 Select Index, Quality is MSCI World Ex Australia Quality Index, and Benchmark is MSCI World Index. Inception date is 30 November 1997. Past performance is not indicative of future performance. You cannot invest in an index.
Expansionary environments, spurred on by higher business confidence, can lift demand, investment and order books, giving companies with strong competitive positions more scope to increase EPS growth. The economic data suggests the US is experiencing one of those environments now.
Growth is wearing a hard hat
Growth investing does not require investors to concentrate their money in seven companies.
AMD (NASDAQ: AMD) offers a case in point. Its recent decision to raise chip prices underscores its growing importance in the AI supply chain. Second-quarter revenue rose 50% year on year, while demand for the processors and infrastructure powering AI continues to support its earnings outlook. Against that backdrop, AMD recently became only the fourth semiconductor company to reach a US$1 trillion valuation.
More broadly, semiconductors are GWTH’s largest subsector overweight for good reason. Sector EPS has risen faster than share prices since 2021, while its forward price-to-earnings ratio has fallen below those of the Nasdaq 100.
Chart 1: Semiconductor forward P/E ratios have fallen below those of Nasdaq 100
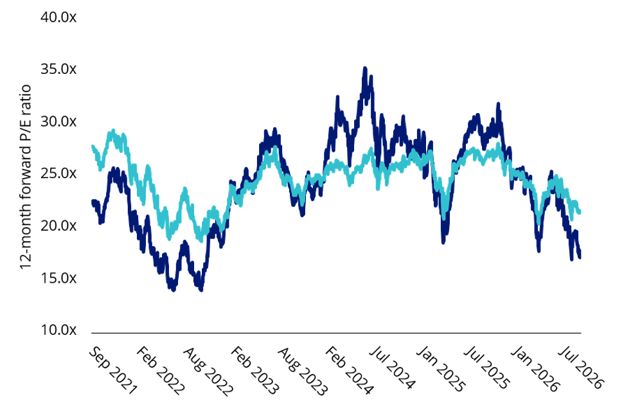
Source: Bloomberg, as at 1 September 2026. You cannot invest directly in an index. Past performance is not indicative of future performance.
Elsewhere, Caterpillar (NYSE: CAT) shows that growth is not confined to technology-native companies. The industrials giant’s revenue has risen by US$25 billion over five years, while EPS has increased sixfold over the past decade as construction, mining and demand for reliable power have strengthened its order book.
Both Caterpillar and AMD are holdings in the VanEck MSCI International Growth ETF (GWTH).
One year does not represent a full investment cycle. It is, however, long enough to challenge the assumption that investors must choose a concentrated active portfolio to gain selective exposure to growth companies. The result also shows that investors can gain selective growth exposure without relying as heavily on the Magnificent Seven, which dominate many growth portfolios.
Key risks
An investment in GWTH carries risks associated with ASX trading time differences, financial markets generally, individual company management, industry sectors, foreign currency, country or sector concentration, political, regulatory and tax risks, fund operations and tracking an index. See the PDS and TMD for more details.
GWTH is likely to be appropriate for an investor seeking capital growth, who intends to use it as a major, core, minor or satellite allocation within a portfolio, has an investment timeframe of at least five years and has a high risk/return profile.


Published: 30 September 2026
Any views expressed are opinions of the author at the time of writing and is not a recommendation to act.
VanEck Investments Limited (ACN 146 596 116 AFSL 416755) (VanEck) is the issuer and responsible entity of all VanEck exchange traded funds (Funds) trading on the ASX. This information is general in nature and not personal advice, it does not take into account any person’s financial objectives, situation or needs. The product disclosure statement (PDS) and the target market determination (TMD) for all Funds are available at vaneck.com.au. You should consider whether or not an investment in any Fund is appropriate for you. Investments in a Fund involve risks associated with financial markets. These risks vary depending on a Fund’s investment objective. Refer to the applicable PDS and TMD for more details on risks. Investment returns and capital are not guaranteed.
GWTH is indexed to a MSCI index. GWTH is not sponsored, endorsed or promoted by MSCI, and MSCI bears no liability with respect to [Fund] or the MSCI Index. The PDS contains a more detailed description of the limited relationship MSCI has with VanEck and the Fund.