The growth story investors may have overlooked


For most of the past three years, investors seeking growth in emerging markets have favoured the semiconductor businesses of Taiwan and South Korea.
Meanwhile, Indian stocks were left in the dust. In the 12 months to 29 May 2026, the MSCI India Index lagged the MSCI Emerging Markets Index by 58.7 percentage points in Australian dollar terms.
Chart 1: 12-month net total return differential between MSCI India and MSCI EM
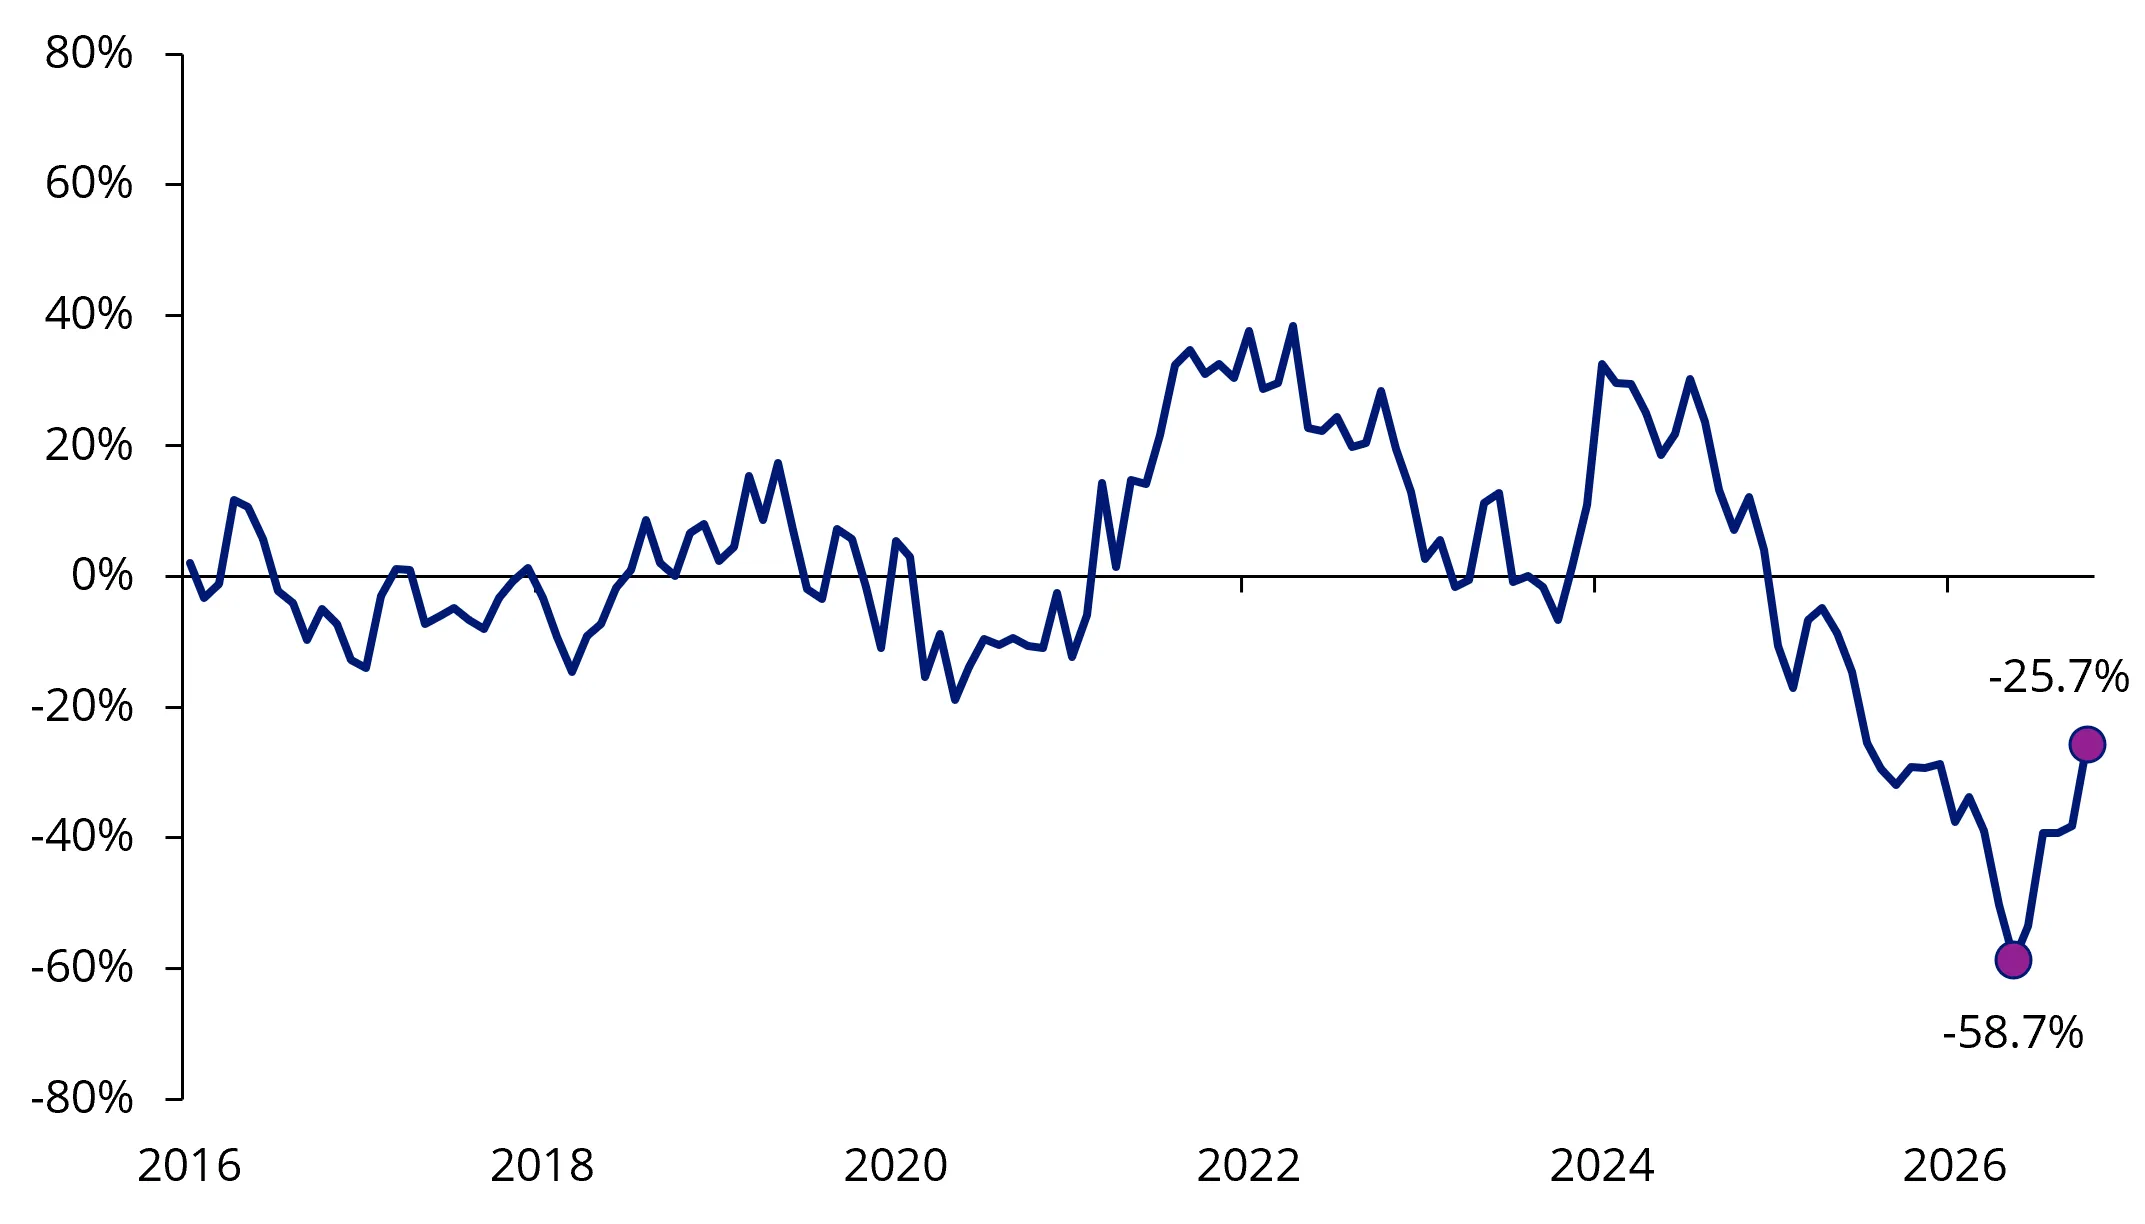
Source: Bloomberg as at 30 October 2026, MSCI net total return indices converted to AUD (monthly). You cannot invest in an index.
Last week, however, India had its moment in the sun. A combination of souring sentiment toward AI companies, falling crude oil prices and a material weakening in the US dollar following the midterm elections all helped to bring foreign investors back to the country.
The Nifty 50 recorded its strongest week since 2021, with foreign investors buying a net US$1.9 billion of Indian shares through Wednesday.
But while investors were focused on the AI build-out, India continued to build its own growth story. We think the return of foreign buyers warrants a closer look at what they may have been overlooking.
A change of directionTo quote a Reuters headline, “Is India Asia’s ultimate “anti-AI” trade?”
India’s market is dominated by heavy industrial conglomerates, banks and energy giants. The country does have a significant IT sector, but these are mostly software export and enterprise consulting firms, not necessarily the businesses involved in the AI build-out.
When investors turned their attention to the AI megatrend, they fled Indian equities which had previously had a significant run in 2024.
Chart 2: Foreign investors have been heading for the exit for the last two years
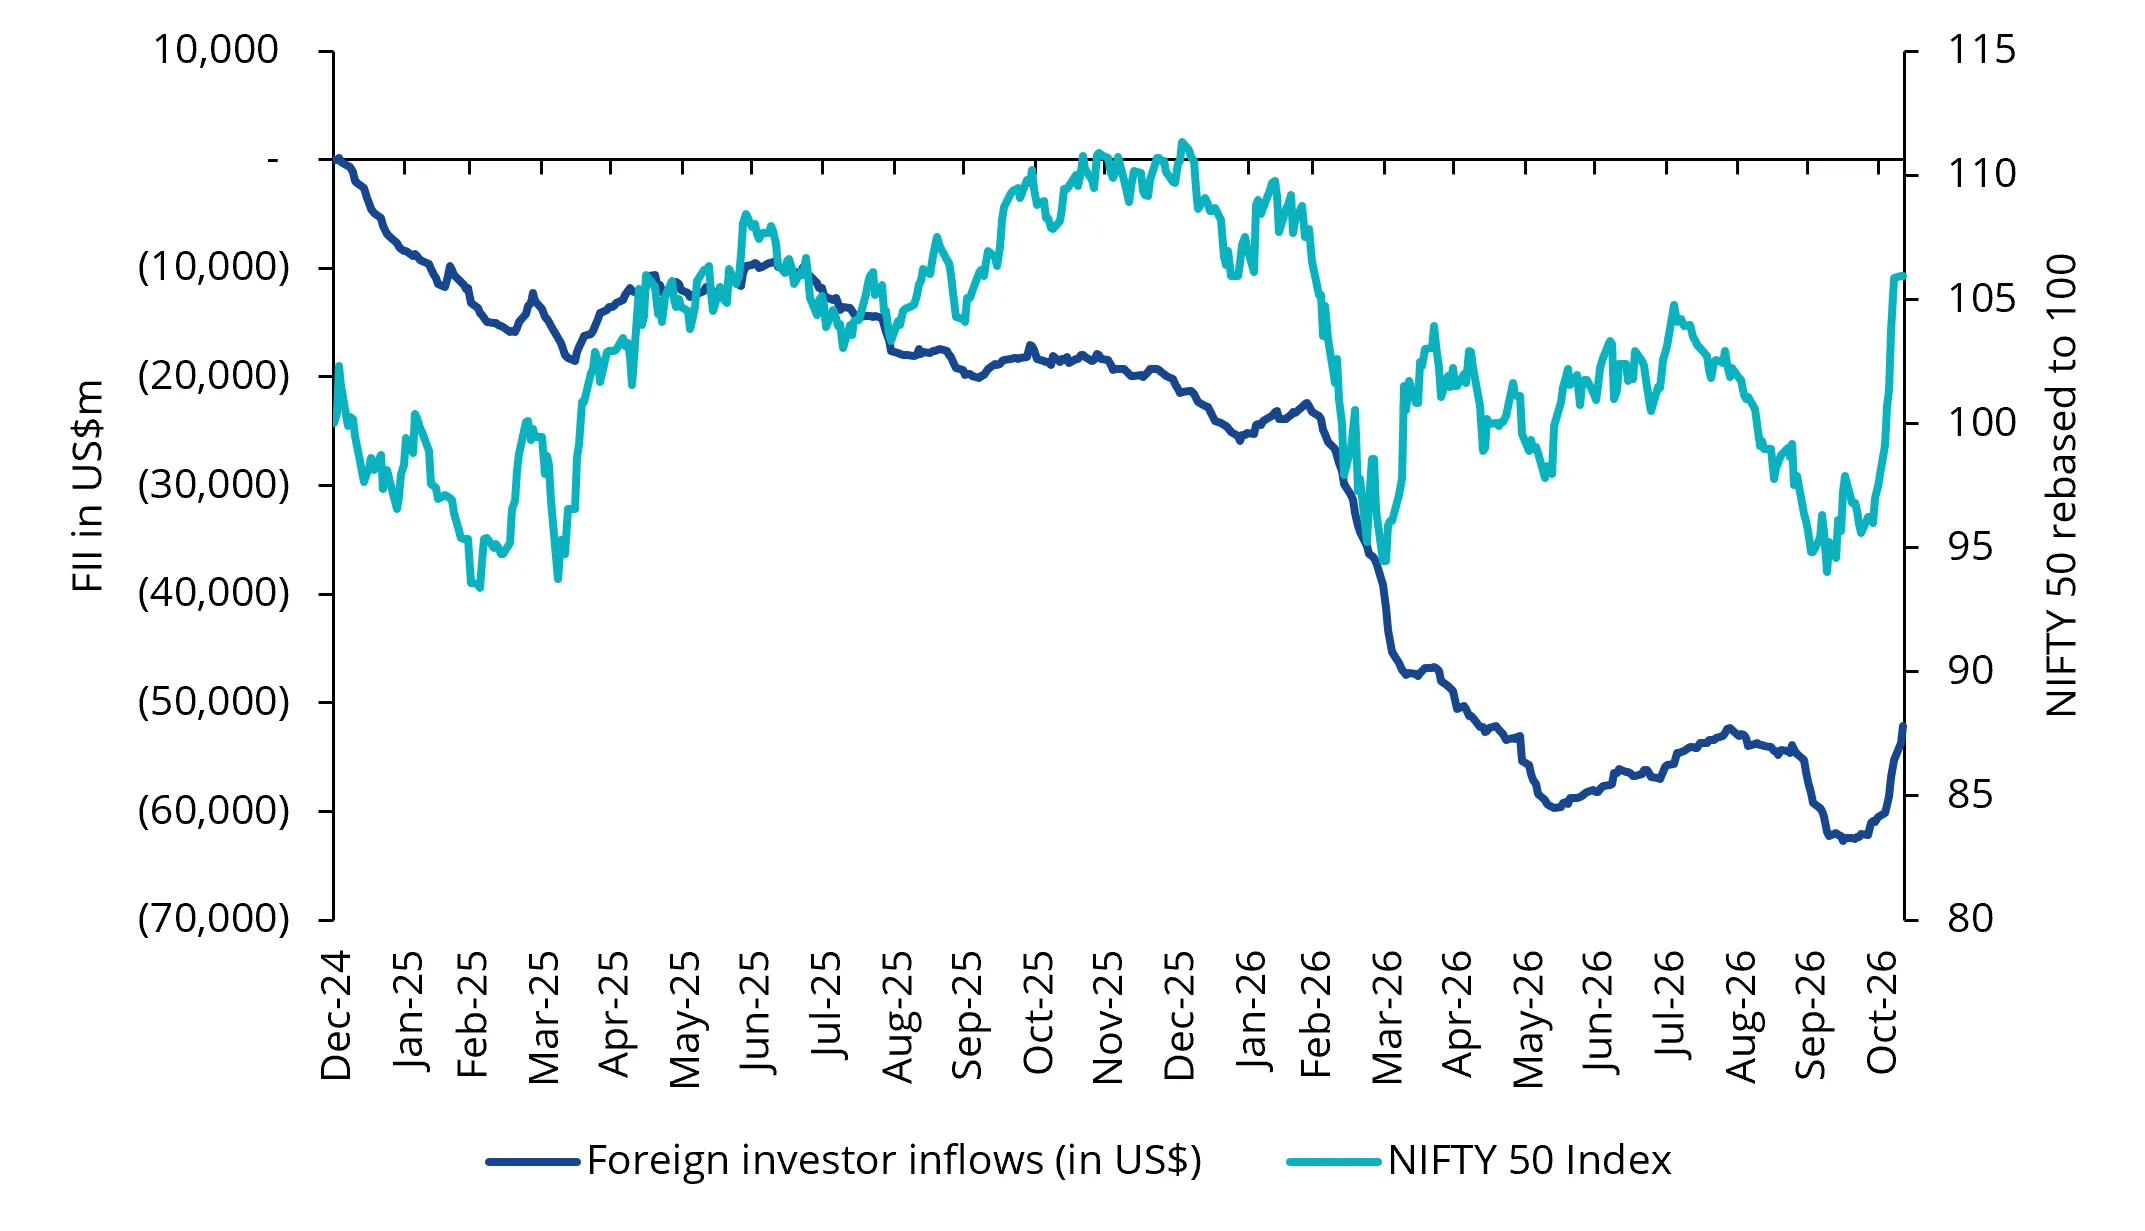
Source: Bloomberg, VanEck. Data to 10 November 2026. You cannot invest in an index.
But given India’s lower exposure to the AI trade could offer a source of diversification within an emerging markets allocation, causing the spike in inflows back into Indian equities.
The correlation data reinforces this case. Over the year to 5 November 2026, the correlation of daily returns between the Nifty 50 and a US AI equities basket was -0.09 in Australian dollar terms.
This means the two assets are uncorrelated. From the perspective of an investor evaluating their portfolio, holding an allocation to both could help spread portfolio risk, although investors should not expect Indian shares to rise every time AI stocks fall.
Chart 3: Rolling correlation of daily returns: NIFTY 50 vs a basket of US-listed AI companies

Source: Bloomberg as at 5 November 2026. The GS Broad AI basket consists of US-listed companies that are pursuing the development of artificial intelligence across all categories: hyperscalers, data center infrastructure, equipment suppliers, power, and commodities. Rolling correlation based on daily total return data over a 252 working day period in AUD. Past performance is not indicative of future performance.
The growth story never fadedThe drivers of India’s economic expansion remain in place.
Private consumption grew 7.1% in real terms between June quarter 2025 and June quarter 2026, supported by stronger household spending.
The infrastructure connecting those consumers and businesses has expanded too. By February 2026, India’s national highway network was around 61% larger than it was back in March 2014. Indian official data says public CapEx has risen more than six-fold since FY15.
Digital infrastructure is also continuing to evolve. India’s Unified Payments Interface, which enables instant bank-to-bank payments, processed 25.5 billion transactions in October 2026 alone, up 23% year-over-year.
All this is a long way of saying that the Indian economy continues to grow in an organic way. In October, the World Bank projected India’s economy would grow 7.1% in FY27, supported by domestic demand and exports. It also identified opportunities for India to benefit from adopting AI, drawing on its technical workforce and digital infrastructure.
Growth deserves some homework
A favourable view on India is one thing but as is with anything, not all investments are created equal.
The Nifty 50 allocates according to market capitalisation, giving larger companies larger weights. That provides exposure to the country’s biggest listed businesses, but size alone tells us little about whether a company offers an attractive combination of growth and valuation.
Our approach starts with the financial statements.
The VanEck India Growth Leaders ETF (GRIN) tracks the MarketGrader India Growth Leaders 50 Index, which assesses companies using 24 fundamental indicators across growth, value, profitability and cash flow. It then selects 50 companies from across the market capitalisation spectrum with strong growth at a reasonable price attributes and weights them equally at rebalance.
The result is a portfolio that delivers higher returns on equity, stronger historical sales and earnings growth, and lower long-term debt relative to capital than either the MSCI Emerging Markets or MSCI World ex Australian indexes.
Table 1: The fundamentals behind the approach
| Metric | VanEck India Growth Leaders ETF (GRIN) | MSCI Emerging Markets Index | MSCI World ex Aus Index |
|---|---|---|---|
| Return on equity (%) | 28.20 | 20.84 | 21.54 |
| Long-term debt to capital (%) | 13.18 | 18.68 | 34.16 |
| Historical three-year earnings per share growth (%) | 49.51 | 24.05 | 24.66 |
| Historical three-year sales growth (%) | 24.62 | 14.21 | 13.71 |
| Price to forward earnings (times) | 15.80 | 8.70 | 17.36 |
Source: FactSet, as at 30 October 2026. You cannot invest directly in an index.
Anecdotally, at the time of writing, GRIN is having a strong month so far.
Table 2: GRIN performance vs Indian benchmark stock market index to 30 October 2026 (%)
| 3 months | 6 months | Year to date | 1 year | Since inception (p.a.) | |
|---|---|---|---|---|---|
| VanEck India Growth Leaders ETF (GRIN) | -3.28 | 1.74 | -7.05 | -10.61 | -8.32 |
| Nifty 50 Total Return Index (in Indian Rupees) | -4.98 | -1.03 | -20.06 | -21.22 | -20.71 |
| Excess return | +1.70 | +2.77 | +13.01 | +10.61 | +12.39 |
Source: Morningstar Direct, VanEck. GRIN’s inception date is 22 April 2025. Past performance is not indicative of future performance. You cannot invest directly in an index.
Looking ahead, Indian equities are currently trading at close to their long run average on a price-to-forward earnings basis. Renewed foreign interest and robust economic growth give investors a reason to revisit India. GRIN applies the same discipline through changing sentiment: identifying growing businesses while paying attention to their financial strength and valuations.
Key risks
An investment in the ETF carries risks associated with: ASX trading time differences, India, financial markets generally, individual company management, industry sectors, foreign currency, sector concentration, political, regulatory and tax risks, market access, fund operations, liquidity and tracking an index. See the PDS for more details on risk.
GRIN is likely to be appropriate for a consumer who is seeking capital growth, is intending to use the product as a satellite allocation within a portfolio, has an investment timeframe of at least 5 years, and has a very high risk/return profile.


Published: 16 November 2026
Any views expressed are opinions of the author at the time of writing and is not a recommendation to act.
VanEck Investments Limited (ACN 146 596 116 AFSL 416755) (VanEck) is the issuer and responsible entity of all VanEck exchange traded funds (Funds) trading on the ASX. This information is general in nature and not personal advice, it does not take into account any person’s financial objectives, situation or needs. The product disclosure statement (PDS) and the target market determination (TMD) for all Funds are available at vaneck.com.au. You should consider whether or not an investment in any Fund is appropriate for you. Investments in a Fund involve risks associated with financial markets. These risks vary depending on a Fund’s investment objective. Refer to the applicable PDS and TMD for more details on risks. Investment returns and capital are not guaranteed.
MarketGrader" and MarketGrader India Growth Leaders 50 Index are trademarks of MarketGrader.com Corp. and have been licensed for use for certain purposes by VanEck. GRIN is based on the MarketGrader India Growth Leaders 50 Index, but is not sponsored, endorsed, sold or promoted by MarketGrader, and MarketGrader makes no representation regarding the advisability of investing in GRIN.