Australia’s share market has more to offer than two stocks


BHP and CBA accounted for more than half September’s market decline. Owning 200 stocks may spread your money less than you think.
Owning 200 Australian companies through a broad-based ETF sounds like a sensible way to avoid depending on a handful of businesses. But that could not be further from the truth.
In September, two stocks – BHP and Commonwealth Bank – made up more than 20% of the entire market capitalisation of the S&P/ASX 200. Both had significant falls; BHP fell 6.2% while CBA fell 5.6%. As a result, the Big Australian and the world’s most expensive bank accounted for 54% of the index’s 2.42% fall. Every other stock in the index accounted for the remaining 46%.
Chart 1: S&P/ASX 200: Weight versus share of September decline
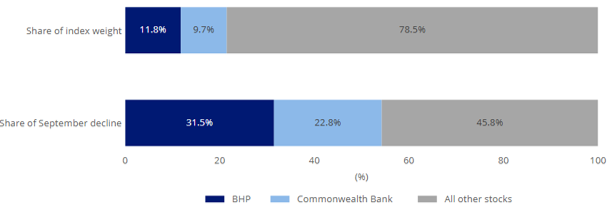
Source: FactSet, VanEck. Based on average index weights and contributions to return over September 2026. Shares of the decline may not sum to 100 due to rounding. Past performance is not indicative of future performance.
All this has exposed a distinction that matters for anyone building an Australian share portfolio. Owning more companies does not guarantee that the risks in your Australian equities’ allocation are well distributed.
The S&P/ASX 200 weights companies by market capitalisation, meaning larger companies receive larger allocations. If an investor invests in an market capitalisation index-tracking ETF, more money will go towards the index’s biggest constituents, regardless of whether the investor intended to do so.
Long-time readers of our work will know that we view this as a structural issue. At present, 11 stocks make up half of the S&P/ASX 200, and BHP is nearly 12% of the entire stock market.
Investors buying an Australian equity strategy would think it is unlikely that two stocks would be more than 20% of the portfolio, nor would they think two sectors represent over 50% of the portfolio. But this is what concentration risk looks like.
A measure called the “effective number of stocks” helps reveal what a holdings count won’t. This metric gauges the concentration level of an index, indicating how many stocks are driving its movements. It can help work out whether a smaller or larger group of stocks is having the most impact in the index’s up or down movements. The lower the effective number of stocks, the more concentrated the index is by weight.
For the S&P/ASX 200, the effective number of stocks is 27, based on average weights over September. In other words, the S&P/ASX 200 has the same concentration by weight as a portfolio of about 27 companies held at 3.7% each.
In the case of the VanEck Australian Equal Weight ETF (MVW), that figure is around 75 – which also happens to be the exact number of stocks in MVW’s portfolio. That makes the fund around 2.8 times more diversified than an ETF which tracks the S&P/ASX 200.
It should be noted that a score of 27 does not mean the returns or risks of the S&P/ASX 200 match a 27-stock portfolio. The measure considers weights, rather than differences between businesses or how their share prices move together.
It does, however, explain why owning an ETF that tracks the S&P/ASX 200 is closer to owning a concentrated portfolio of large companies than an investor may realise. It also explains why a big move in a mid or small cap, whether it’s upwards or downwards, barely dents the overall performance of the index.
Equal weighting addresses that imbalance by giving each company the same allocation at rebalance. The largest businesses remain part of the portfolio, while other companies receive enough capital to make a more meaningful contribution.
Table 1: Effective number of stocks – ASX 200 vs MVW
|
September 2026 comparison |
S&P/ASX 200 |
MVW |
|---|---|---|
|
Number of holdings |
200 |
75 |
|
Effective number of stocks, rounded |
27 |
75 |
Source: FactSet, VanEck. Effective number of stocks is the inverse of the sum of squared portfolio weights. S&P/ASX 200 based on average weights over September 2026; MVW based on holdings at 30 September 2026.
As at 30 September 2026, no single MVW position exceeded 2%. Its 75 holdings produced an effective-stock count close to 75 because their weights were similar.
When investing in this equal weight ETF, each company receives the same target weight at rebalance, with weights then changing as share prices move. MVW is the only broad-based Australian equities ETF that takes an equal weighted approach.
Another thing to note is that when the stock market has seen concentration this high in the past, investors have been wise to favour a more balanced approach over the following five years.
Chart 2: At today’s Top 10 concentration of >49%, equal weight has historically beaten the market
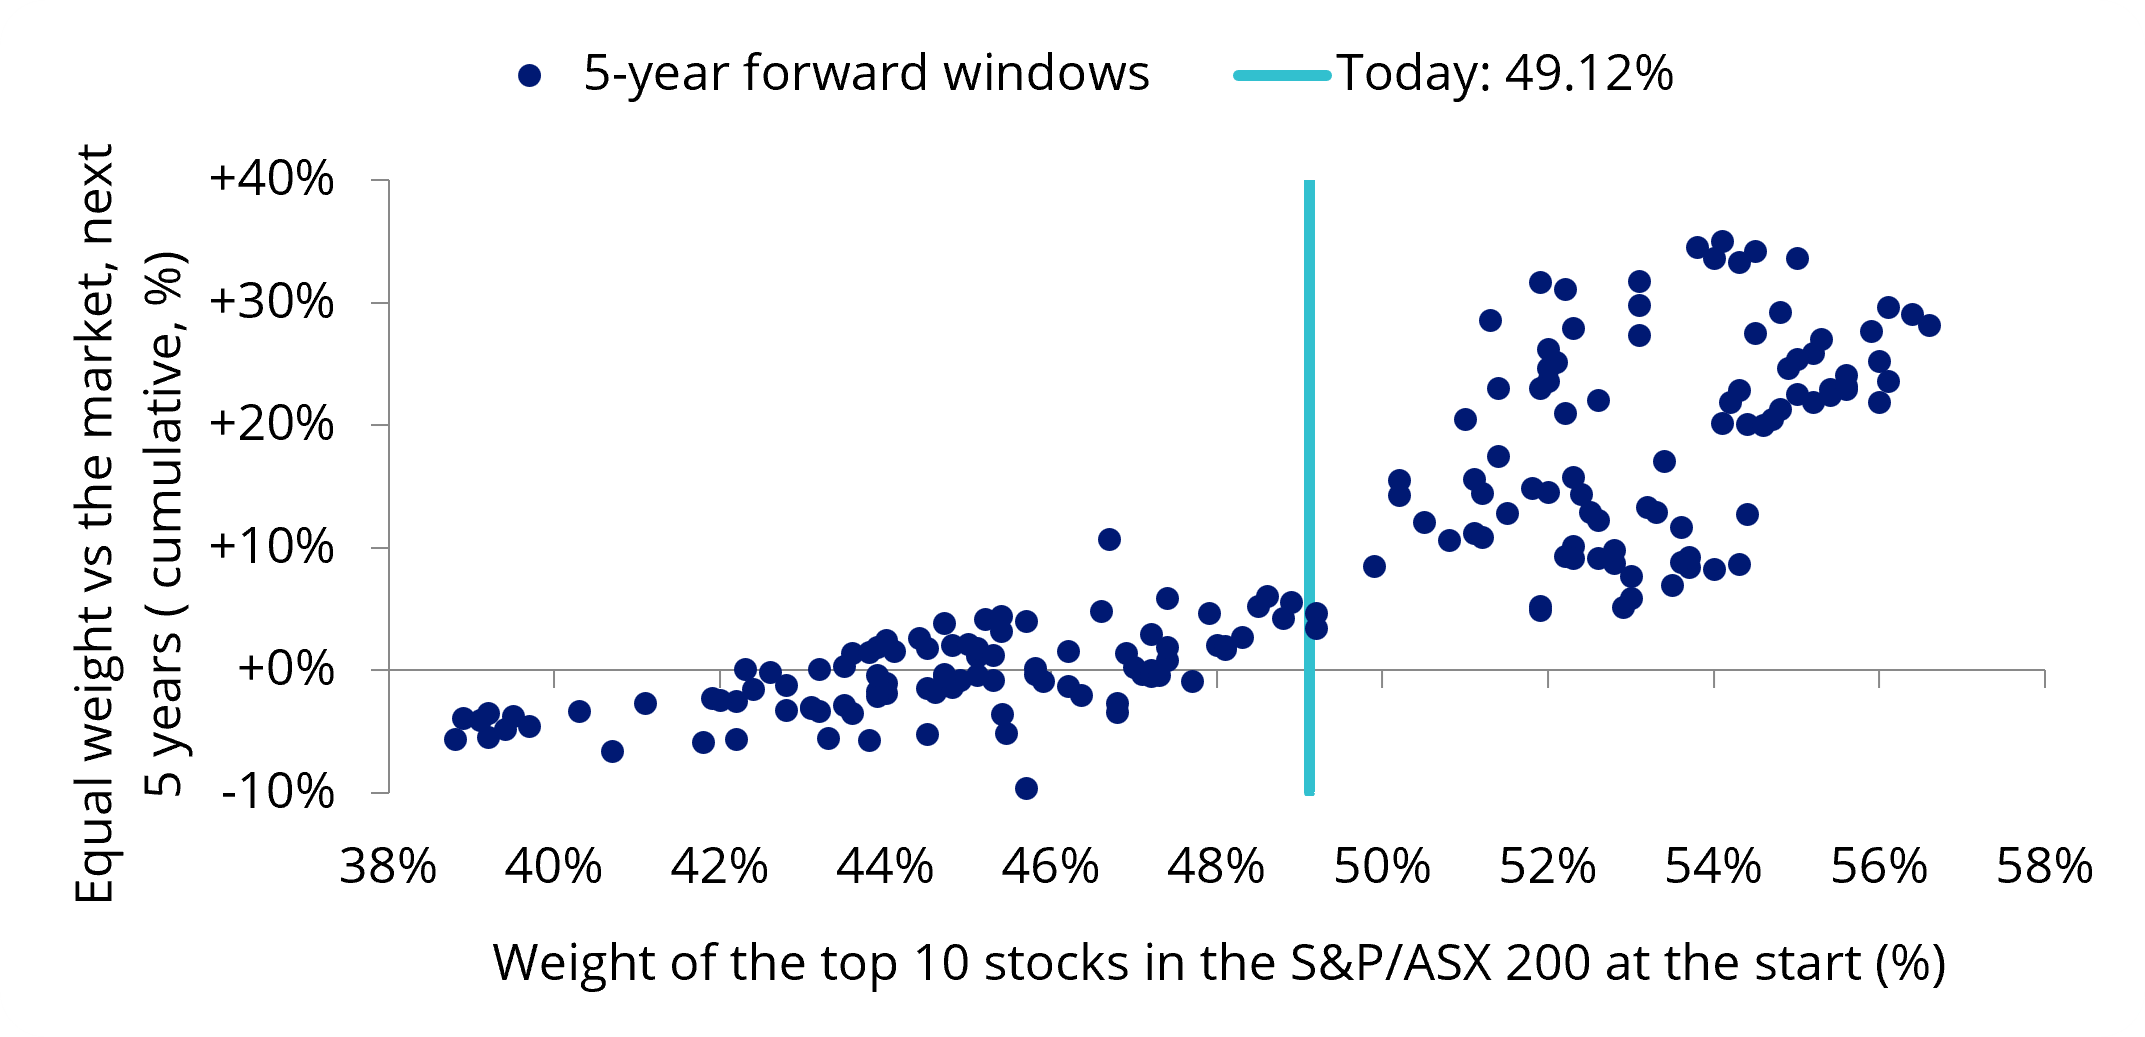
Source: MarketVector, S&P, FactSet. Month-end observations February 2006 to September 2026. Current concentration as at 31 March 2026. Past performance is not indicative of future performance. Equal Weight is represented by the MVIS Australia Equal Weight Index.
Finally, the investment case extends beyond limiting the impact of falling giants. A look beneath the surface reveals that other large cap names such as Ramsay Health Care, Northern Star and JB Hi-Fi rose in September even though the market fell. Giving businesses beyond the largest companies more weight creates greater scope to participate in their success.
VanEck’s research identifies increased exposure to smaller constituents as an important explanation for equal weighting’s historical outperformance.
There are trade-offs. Equal weighting can lag when the largest companies lead, and MVW has fewer holdings and different sector allocations from the S&P/ASX 200. Lower concentration does not guarantee lower volatility or prevent losses.
But investors need not predict whether BHP or CBA will lead the next advance or decline. We think the simpler and more effective way to gain exposure to the Australian equity market is to equal weight.
Key risks
An investment in our Australian equal weight ETF carries risks associated with: financial markets generally, individual company management, industry sectors, fund operations and tracking an index. See the VanEck Australian Equal Weight ETF PDS and TMD for more details.
MVW is likely to be appropriate for a consumer who is seeking capital growth and a regular income distribution, is intending to use the product as a core, minor or satellite allocation within a portfolio, has an investment timeframe of at least 5 years, and has a high risk/return profile.

Published: 08 October 2026
Any views expressed are opinions of the author at the time of writing and is not a recommendation to act.
VanEck Investments Limited (ACN 146 596 116 AFSL 416755) (VanEck) is the issuer and responsible entity of all VanEck exchange traded funds (Funds) trading on the ASX. This information is general in nature and not personal advice, it does not take into account any person’s financial objectives, situation or needs. You should consider whether or not an investment in any Fund is appropriate for you. Investments in a Fund involve risks associated with financial markets. These risks vary depending on a Fund’s investment objective. Refer to the applicable product disclosure statement (PDS) and target market determination (TMD) available at vaneck.com.au for more details. Investment returns and capital are not guaranteed.