Where to find positive returns in a share market going nowhere


The wait for a rate cut can be an opportunity for quality investing. History offers a useful guide, backed by today’s earnings and valuations.
The RBA itself does not know when it has hiked one time too many nor does it know whether its first rate cut may arrive too late to prevent a sharper slowdown. And given, we argue, Australia is in a stagflationary environment, that is one where inflation is elevated but economic growth is sluggish, the case for relief is even more complicated.
For investors, we think the justification for investing in “quality” businesses, those that can sustain earnings through the cycle, is more compelling now than it has been in years.
Australia has plenty of quality companies. The challenge is building a portfolio that delivers their intended benefits in a narrow, concentrated market, where traditional quality screens may not deliver the results investors are seeking.
The RBA’s timing problem
RBA deputy governor Andrew Hauser’s comments at last week’s Citi Investment Conference highlight why the path to lower rates remains uncertain.
He described an easing labour market and tepid consumption alongside an inflation outlook that looks “materially worse” than the bank projected in August. Higher oil prices because of the Iran conflict add to the challenge, with Hauser warning that persistent supply shocks can feed into broader inflation and inflation expectations.
These are the “hard choices” Hauser says the board faces. Tighten too far and the RBA risks pushing Australia into recession; ease too soon and it risks prolonging inflation. Investors cannot assume the RBA will be able to get that balance right.
What happens between the last hike and the first cut
The wait between the RBA’s final hike and first cut has also varied in length as the facts changed in real time.
In 2008, it lasted around six months as the global financial crisis unfolded. But in 2010–11, it stretched to about a year as the mining investment boom coincided with European sovereign debt concerns. In 2023–25, inflation’s retreat towards target involved a wait of more than 15 months. The easing cycle that followed, however, proved to be short-lived.
The table below compares the MSCI Australia IMI Quality Plus Index (AQTY Index) with the broader market, large caps, mid-caps and small caps across different market scenarios: the GFC, the European debt crisis and the post-COVID inflation surge. Each presented a different test for quality.
Table 1: Cumulative returns between the RBA’s final hike and first cut
| Index | 5 Mar–3 Sep 2008 | 3 Nov 2010–2 Nov 2011 | 8 Nov 2023–19 Feb 2025 |
|---|---|---|---|
| AQTY Index | −0.04% | −7.43% | 29.52% |
| S&P/ASX 200 | −3.70% | −7.41% | 25.82% |
| Australian large caps | −2.31% | −6.91% | 25.48% |
| Australian mid-caps | −8.13% | −8.91% | 27.45% |
| Australian small caps | −9.92% | −11.80% | 24.18% |
Source: Bloomberg, VanEck. Cumulative total returns over the stated periods. AQTY Index is the MSCI Australia IMI Quality Plus Index. Australian large caps is the S&P/ASX 50, Australian mid-caps is the S&P/ASX MidCap 50 and Australian small caps represented by S&P/ASX Small Ordinaries. Performance shown is of indices, not AQTY. Data before the index’s launch on 21 May 2026 is simulated using the current methodology. You cannot invest directly in an index. Past performance is not indicative of future performance.
In 2008, the AQTY Index finished close to flat while all four comparisons declined. In 2023–25, at a time when markets continued to rally in the face of higher interest rates, quality as a style delivered the strongest return of the group.
In the 2010–11 period, the fall in quality stocks was in line with the broad market. However, the AQTY Index outperformed mid-caps and small caps.
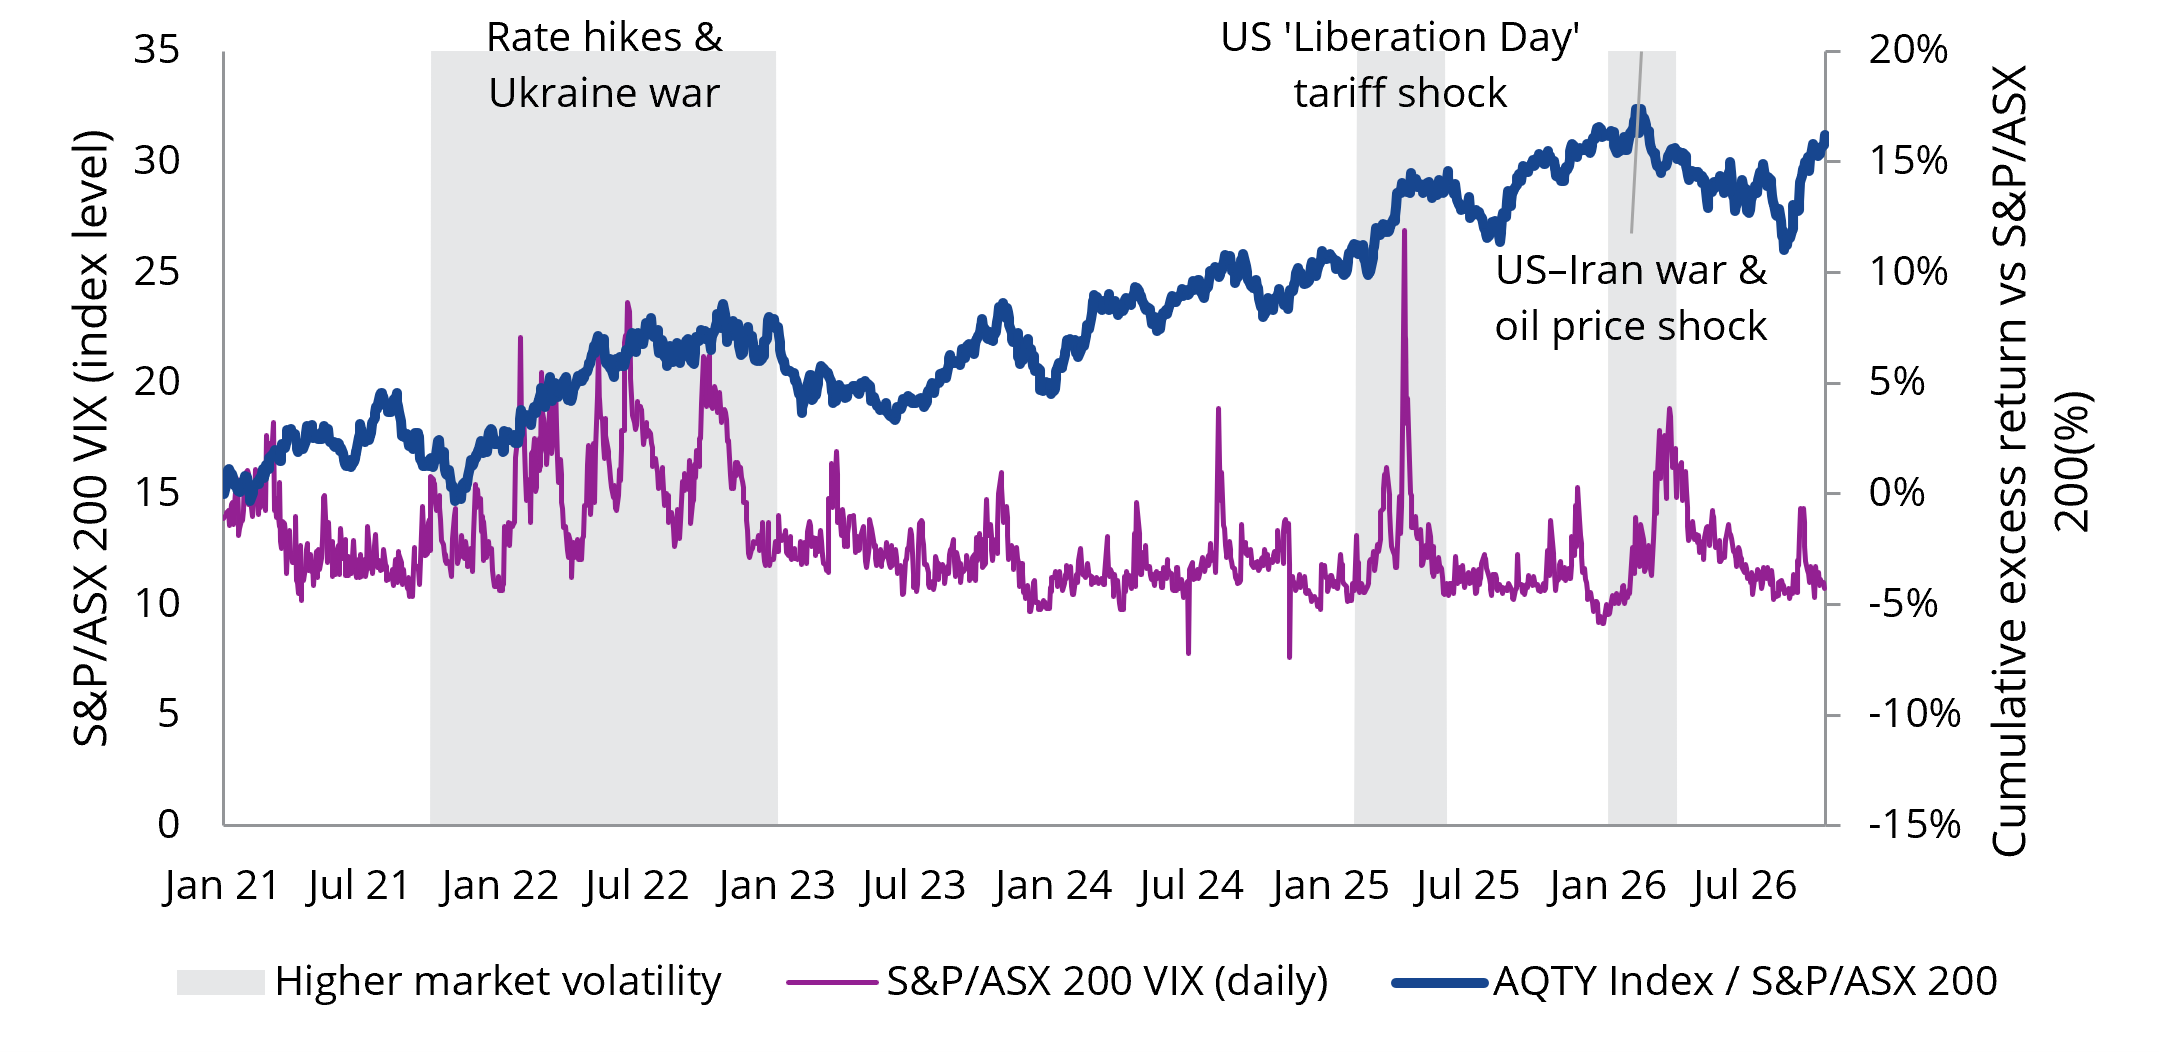
The case for quality also extends beyond the interest rate cycle. The chart below shows the AQTY Index was able to outperform the S&P/ASX 200 during several periods of heightened volatility over the last five years.
Chart 1: AQTY Index relative performance versus the S&P/ASX 200 VIX
Source: Bloomberg, VanEck. As at 16 October 2026. Past performance is not indicative of future performance.
We highlighted AQTY’s index performance in periods of volatility in our white paper released earlier this year, The narrow market untangled.
Across the six major stress events of the 21st century, whether it be the Global Financial Crisis, the COVID-19 drawdown or the 2022 rising rate cycle, the AQTY Index has outperformed the S&P/ASX 200 in each case.
Table 2: AQTY Index cumulative returns through major stress events
| AQTY Index | S&P/ASX 200 | Excess return | |
|---|---|---|---|
| Dot-com (Mar 2002 to Mar 2003) | -5.8% | -11.4% | +5.6% |
| GFC (Nov 2007 to Feb 2009) | -39.4% | -47.8% | +8.4% |
| European debt crisis (Apr to Sep 2011) | -12.6% | -15.6% | +2.9% |
| China slowdown (Apr 2015 to Feb 2016) | -12% | -13.2% | +1.3% |
| COVID-19 (Feb to Mar 2020) | -33.6% | -35.9% | +2.3% |
| Rising rates (Jan to Sep 2022) | -5.4% | -9.6% | +4.2% |
Source: VanEck, Morningstar. Past performance is not a indicative of future performance.
The earnings behind the allocation
The VanEck MSCI Australian Quality Plus ETF (AQTY) assesses companies for these characteristics: profitability, earnings quality, earnings variability and leverage levels. But it also factors in metrics such as valuation, share price momentum and low volatility to help construct a portfolio that both acts as and is a quality exposure.
The latest portfolio data shows how those characteristics compare with the broader market. As Table 3 shows, AQTY’s current holdings have higher average return on equity, free cash flow yield and dividend yield than the S&P/ASX 200, while also being cheaper on earnings and cash flow measures.
Table 3: AQTY portfolio characteristics versus the S&P/ASX 200
| Metric | AQTY | S&P/ASX 200 |
|---|---|---|
| Return on equity | 13.2% | 12.7% |
| Price to earnings | 18.5x | 18.9x |
| Price to cash flow | 12.0x | 12.7x |
| Price to free cash flow | 16.9x | 20.6x |
| Free cash flow yield | 5.9% | 4.9% |
| Dividend yield | 3.42% | 3.23% |
Source: FactSet, as at 19 October 2026. Portfolio characteristics are not forecasts of fund returns. Dividend yield reflects the underlying portfolio and is not indicative of future distributions from AQTY.
Investors cannot choose the date of the last rate hike or the first rate cut, but they can choose the quality of the companies they own while they wait.
Key risks
An investment in the ETF carries risks associated with financial markets generally, individual company management, industry sectors, fund operations and tracking an index. See the PDS and TMD for more details.
AQTY is likely to be appropriate for a consumer who is seeking capital growth and a regular income distribution, is intending to use the product as a core, minor or satellite allocation within a portfolio, has an investment timeframe of at least 5 years, and has a high risk/return profile.


Published: 25 October 2026
Any views expressed are opinions of the author at the time of writing and is not a recommendation to act.
VanEck Investments Limited (ACN 146 596 116 AFSL 416755) (VanEck) is the issuer and responsible entity of all VanEck exchange traded funds (Funds) trading on the ASX. This information is general in nature and not personal advice, it does not take into account any person’s financial objectives, situation or needs. You should consider whether or not an investment in any Fund is appropriate for you. Investments in a Fund involve risks associated with financial markets. These risks vary depending on a Fund’s investment objective. Refer to the applicable product disclosure statement (PDS) and target market determination (TMD) available at vaneck.com.au for more details. Investment returns and capital are not guaranteed.