3 reasons why equal weighting Australian shares may continue to outperform


Last week’s fifth rate rise from the RBA adds more pressure to an Australian economy that is already in a per-capita recession.
But it’s not all bad news.
Higher financing costs, productivity investment, infrastructure spending and changing household demand will not affect every sector equally. That means that the subdued outlook for the index likely masks strong earnings growth which can be earned elsewhere.
In our view, there have always been compelling reasons to reconsider both what Australian equity investors own and how they own it. We believe the weight (and the wait) is over and the VanEck Australian Equal Weight ETF (MVW)’s investment case is as strong as it has been in over a decade.
The weight of historyIf history is any guide, diversification tends to become more valuable when markets become more concentrated.
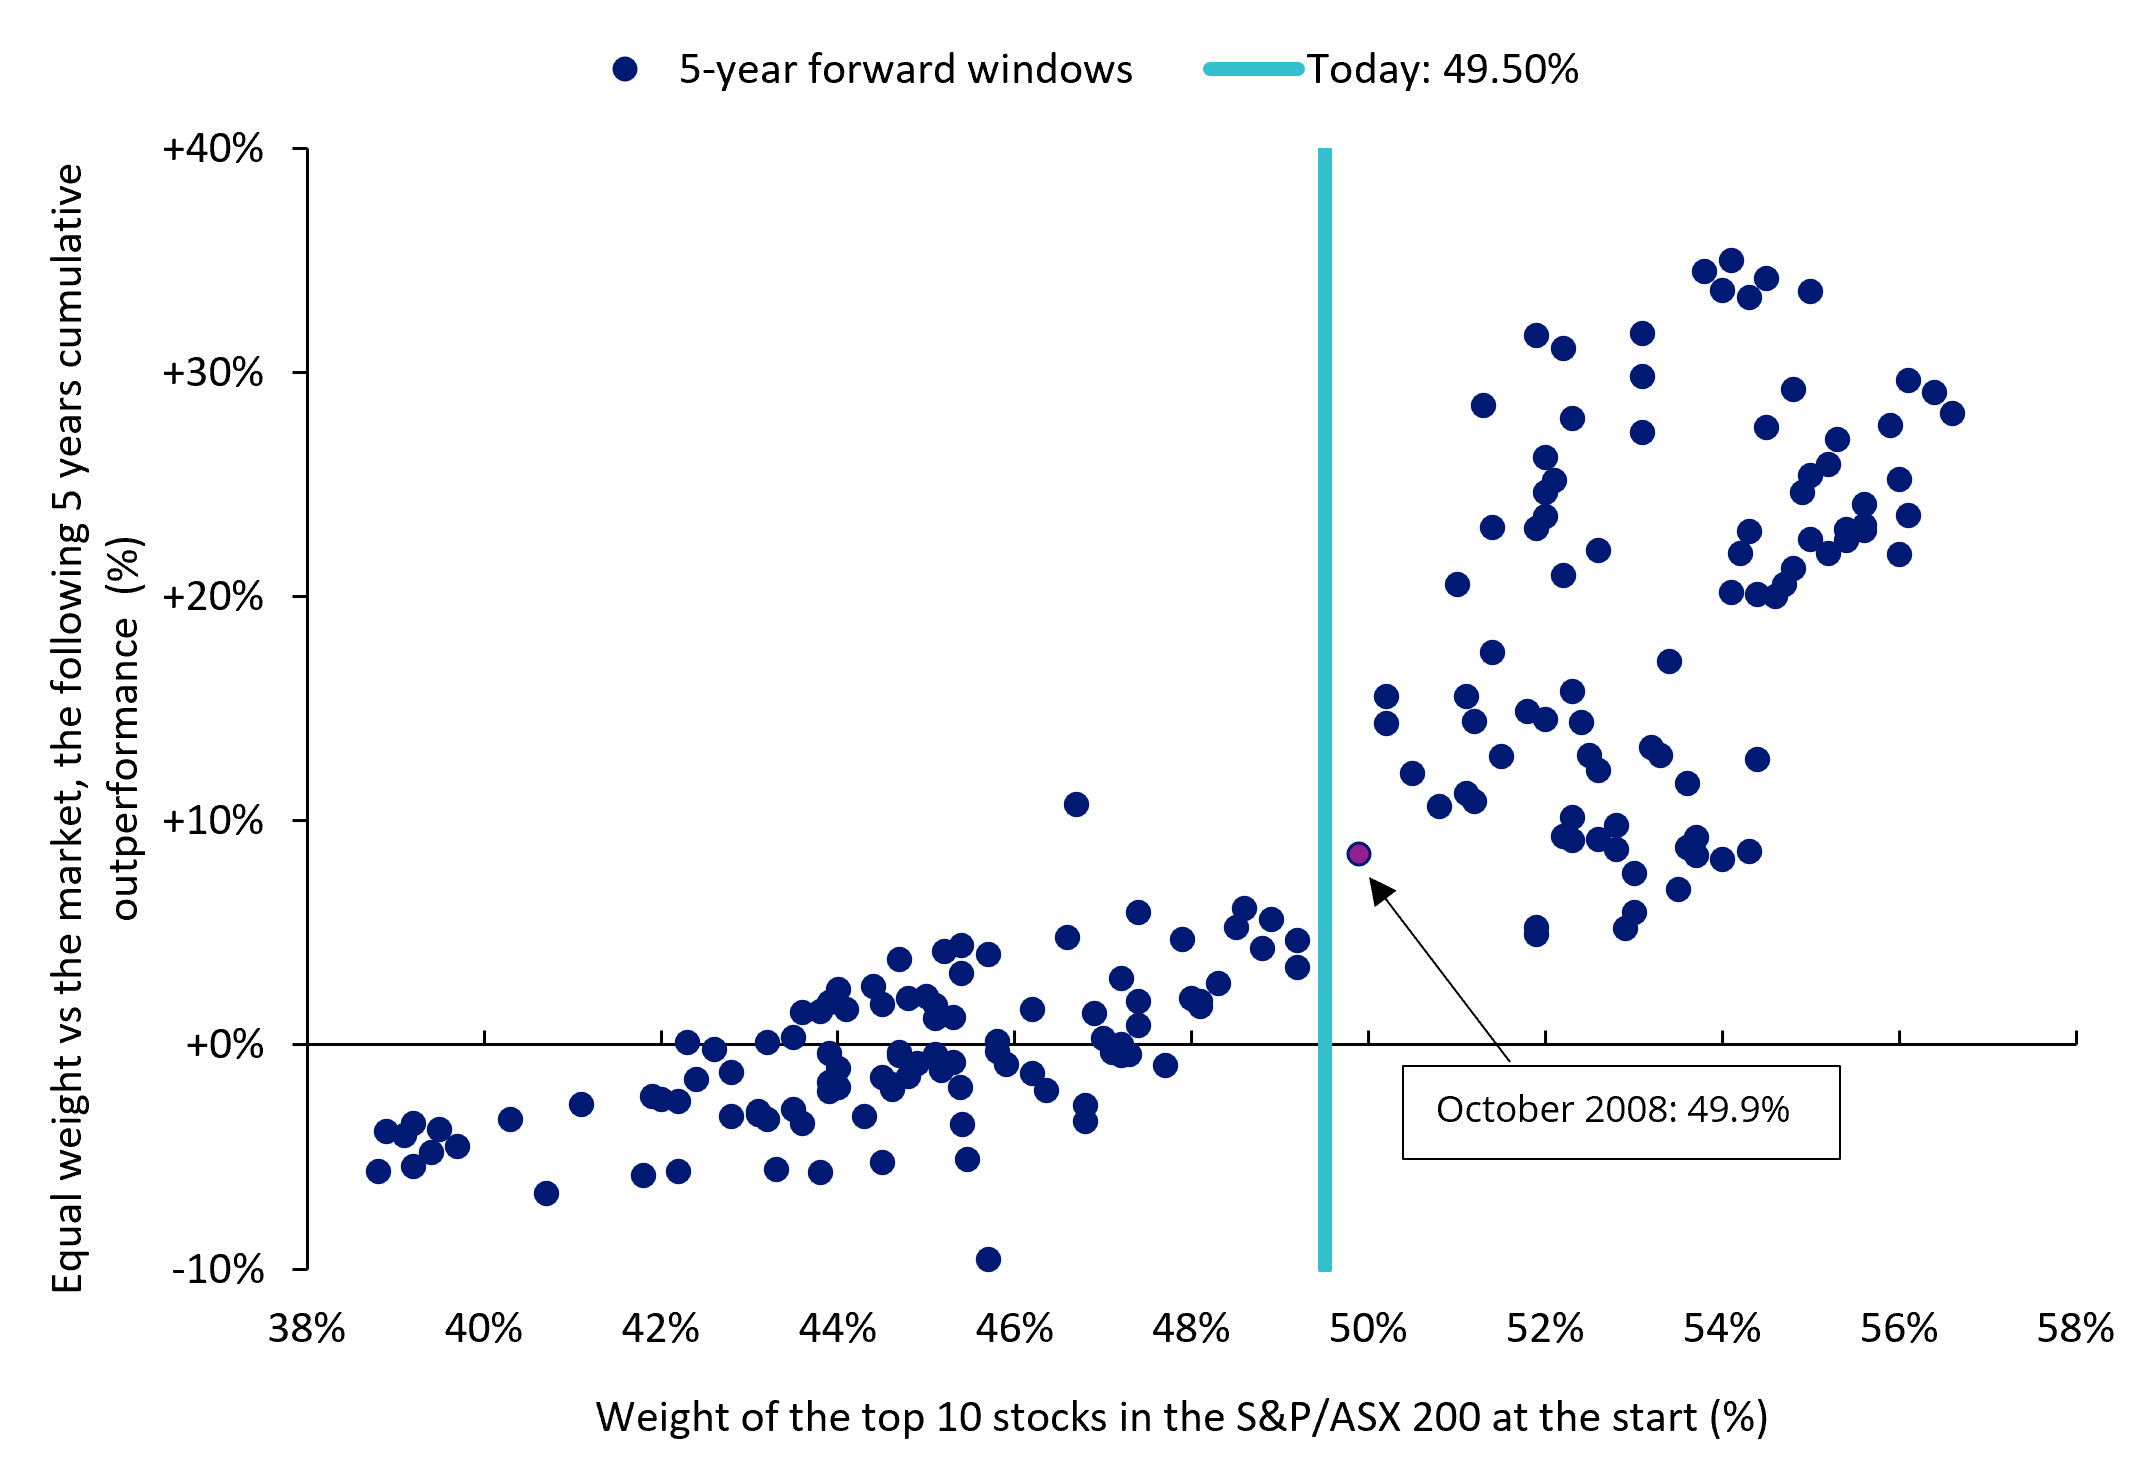
An examination of monthly data between 2006 and 2021 which compares the weight of the benchmark’s ten largest companies with the relative returns of the MVIS Australia Equal Weight Index (MVW Index) over the following five years found that equal weighting has outperformed over every subsequent five-year period in the sample. For example, in October 2008 the S&P/ASX 200 Index’s top 10 was similar to today’s levels (49.9%). In the following five years, the MVW Index outperformed by 1.10% p.a.
Note 2021 is the most recent data as the subsequent five-year period ends in 2026 (which is right now).
Chart 1: At today's top 10 concentration of 49.5% or higher, equal weight has historically beaten the market
Recent returns add to that case. Over six months, MVW has returned 5.65%, compared with 4.60% for the S&P/ASX 200 (to 31 October 2026). It has also outperformed over one and three months and since its 2014 inception. As usual, past performance is not indicative of future performance.
The forward outlookHistory and a company’s market capitalisation can provide context, but investors care more about the future. And nowhere is this arguably truer than in corporate earnings.
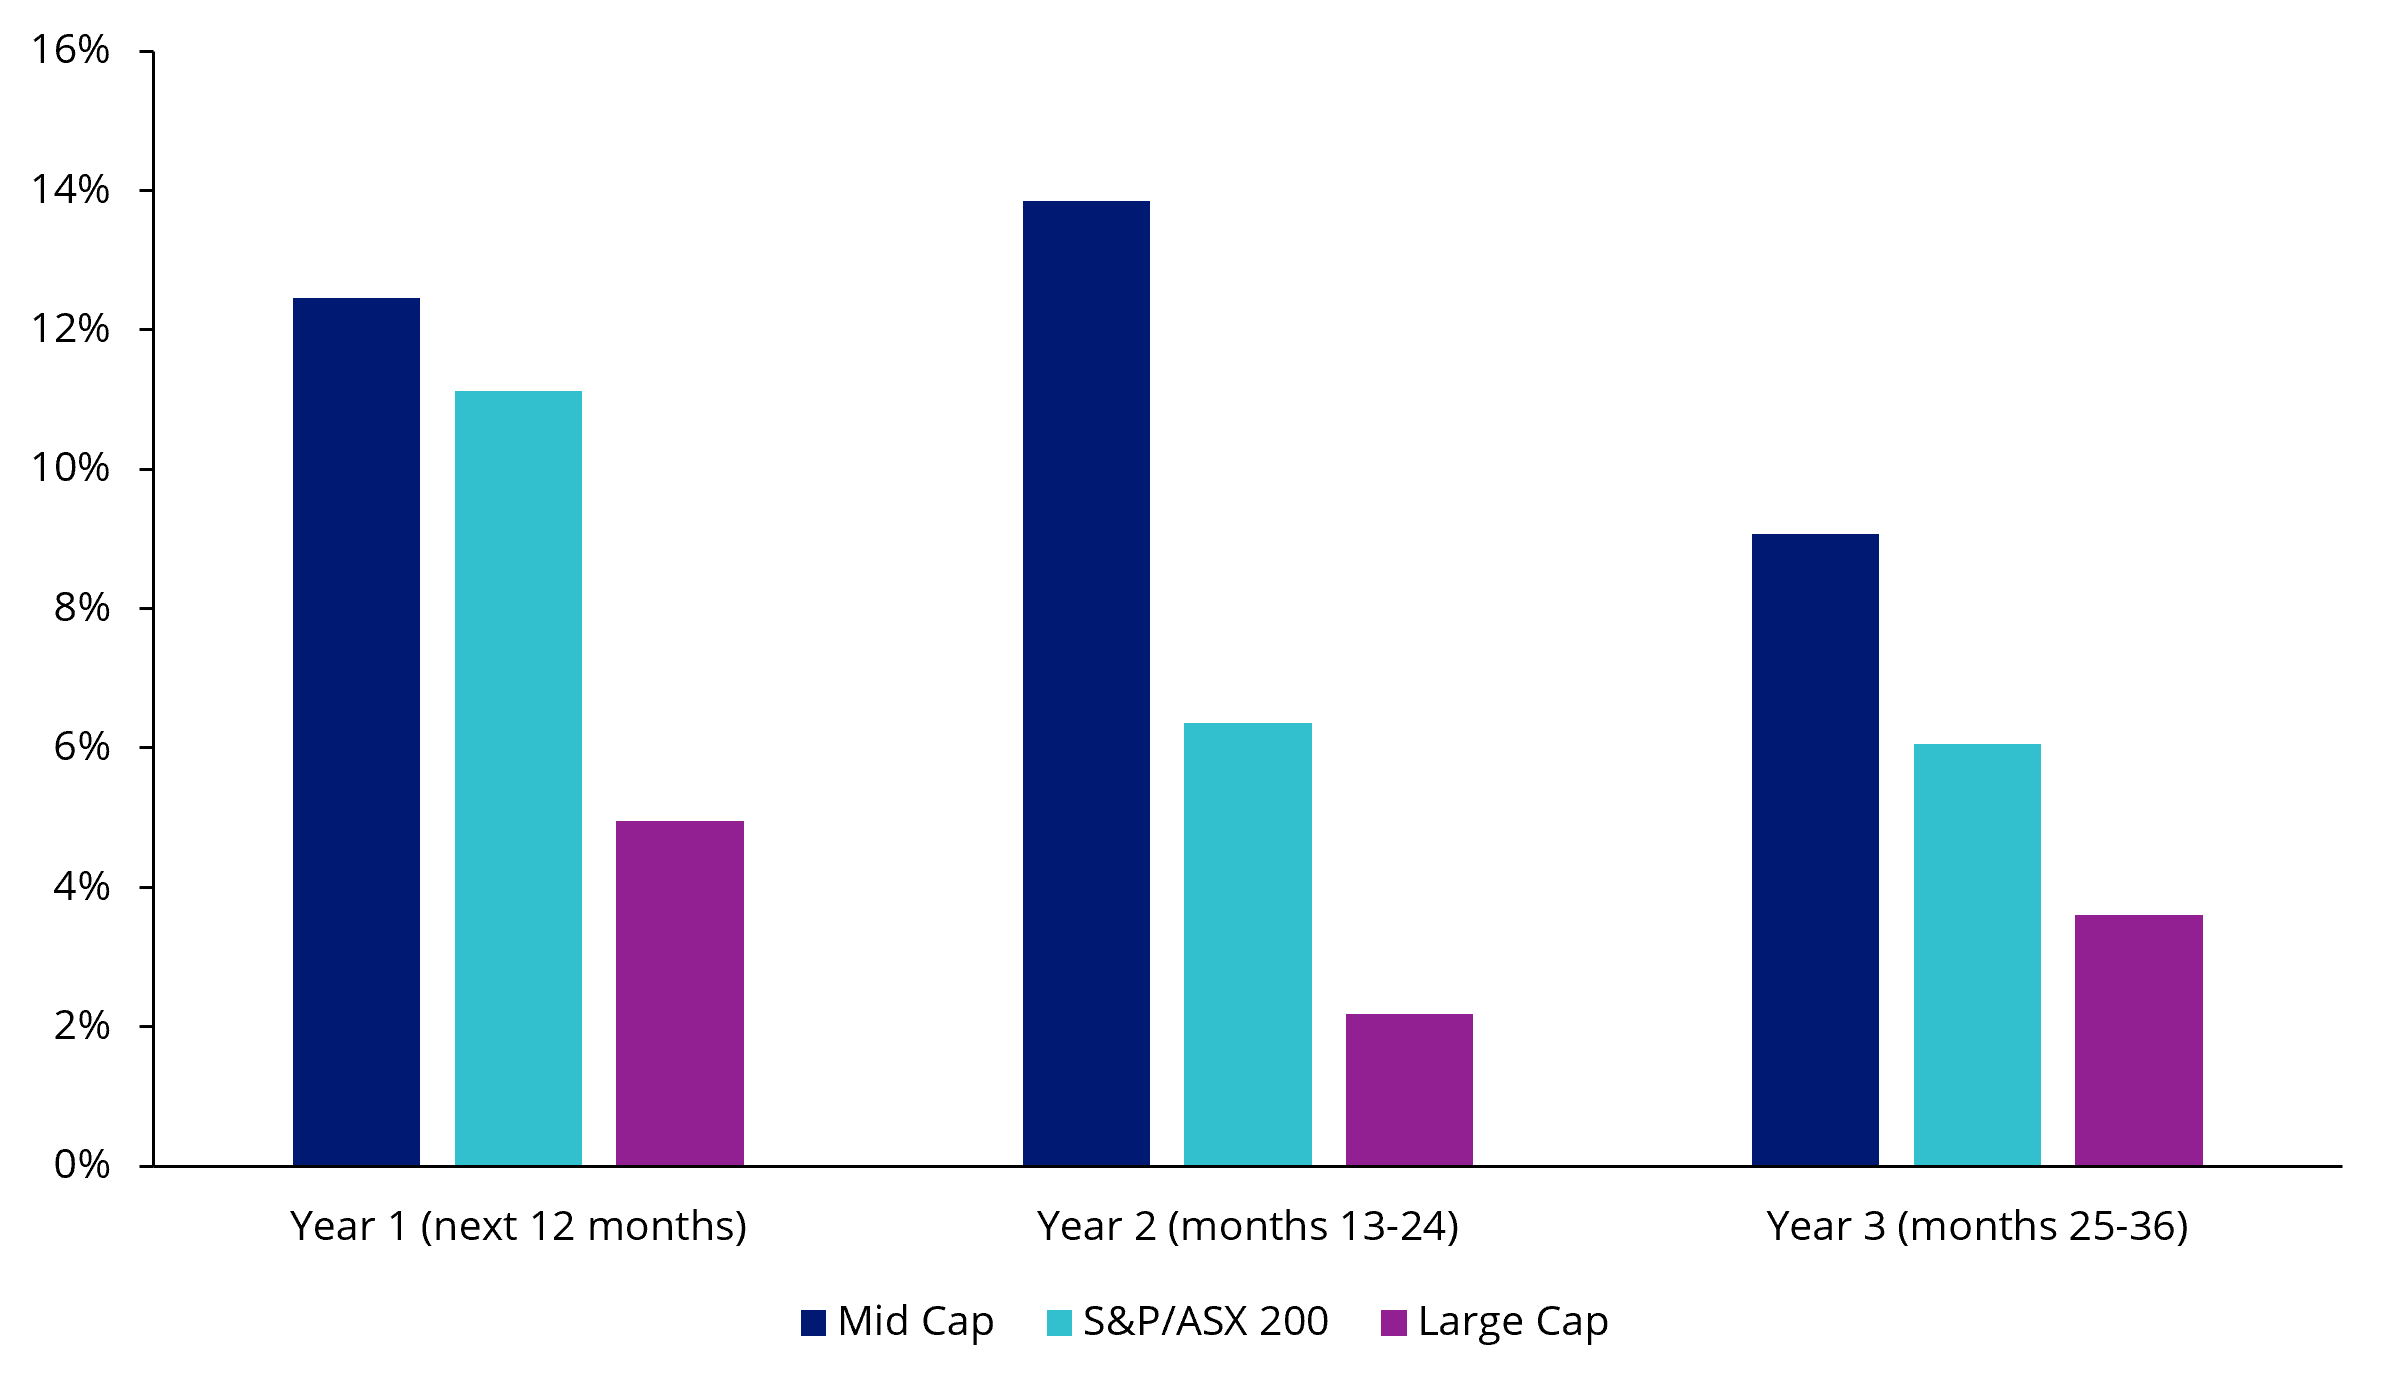
VanEck’s analysis shows earnings expectations are more subdued for the S&P/ASX 200 but are much higher in the mid and small cap space through the 2028 financial year.
Chart 2: Mid-caps offer better EPS growth potential over the next few years
Source: FactSet. VanEck. Bloomberg. Forward EPS forecasts as at 3 November 2026. Rolling forecasts used given different companies end their financial years at different times. Large cap is S&P/ASX 20 Index. Mid cap is S&P/ASX Midcap 50 Index. Past performance is not indicative of future performance. You cannot invest directly in an index.
What’s more, mid-caps are forecast to generate this earnings growth on less demanding valuations than their large cap counterparts, meaning if this dispersion persists, investors can potentially acquire greater earnings growth per dollar invested outside the largest stocks.
MVW provides more exposure to these names while VanEck also runs a separate exposure for Australian mid-caps.
Where the earnings areEarnings leadership is now broadening beyond the banks and resources sectors. The strong forward earnings growth forecasts for mid and small caps are one way to show this, but another is to look at individual companies.
For instance, in its first half 2026 results, premiums at QBE Insurance (ASX: QBE) grew while its combined operating ratio of 93% indicated it still generated an underwriting profit.
QBE also writes 78% of its premiums offshore, meaning its earnings therefore draw on a wider set of economies than Australia alone (unlike, for instance, Commonwealth Bank which is overwhelmingly an Australian business).
You can read more about our thesis for QBE here.
Three reasons equal weighting worksThe S&P/ASX 200 weights companies by market capitalisation, meaning larger companies receive larger allocations. If an investor invests in a market capitalisation index-tracking ETF, more money will go towards the index’s biggest constituents, regardless of whether the investor intended to do so.
September 2026 illustrated how much influence those largest holdings can have. Just two stocks, BHP and Commonwealth Bank, accounted for 54% of the S&P/ASX 200’s 2.42% decline. In contrast, MVW outperformed that month.
The MVW portfolio also rebalances every quarter, adding exposure to relative laggards and reducing exposure to relative winners. In essence, it’s a systematic version of buy low and sell high, which is exactly what an investor wants to see occur.
Another rationale for considering MVW is the interest rate environment. When we compare the performance of different indices vs Equal Weight Index during previous rate hiking cycles (2006 to 2008, 2009 to 2010 and 2022 to 2023), the MVW Index outperformed. Noting that the past performance of the MVW Index is not indicative of the performance of MVW.
Since the first RBA rate hike of 2026 in February, MVW has outperformed the S&P/ASX 200 by 1.44% (as at 5 November 2026).
Chart: How MVW has performed since the first RBA rate hike in February 2026
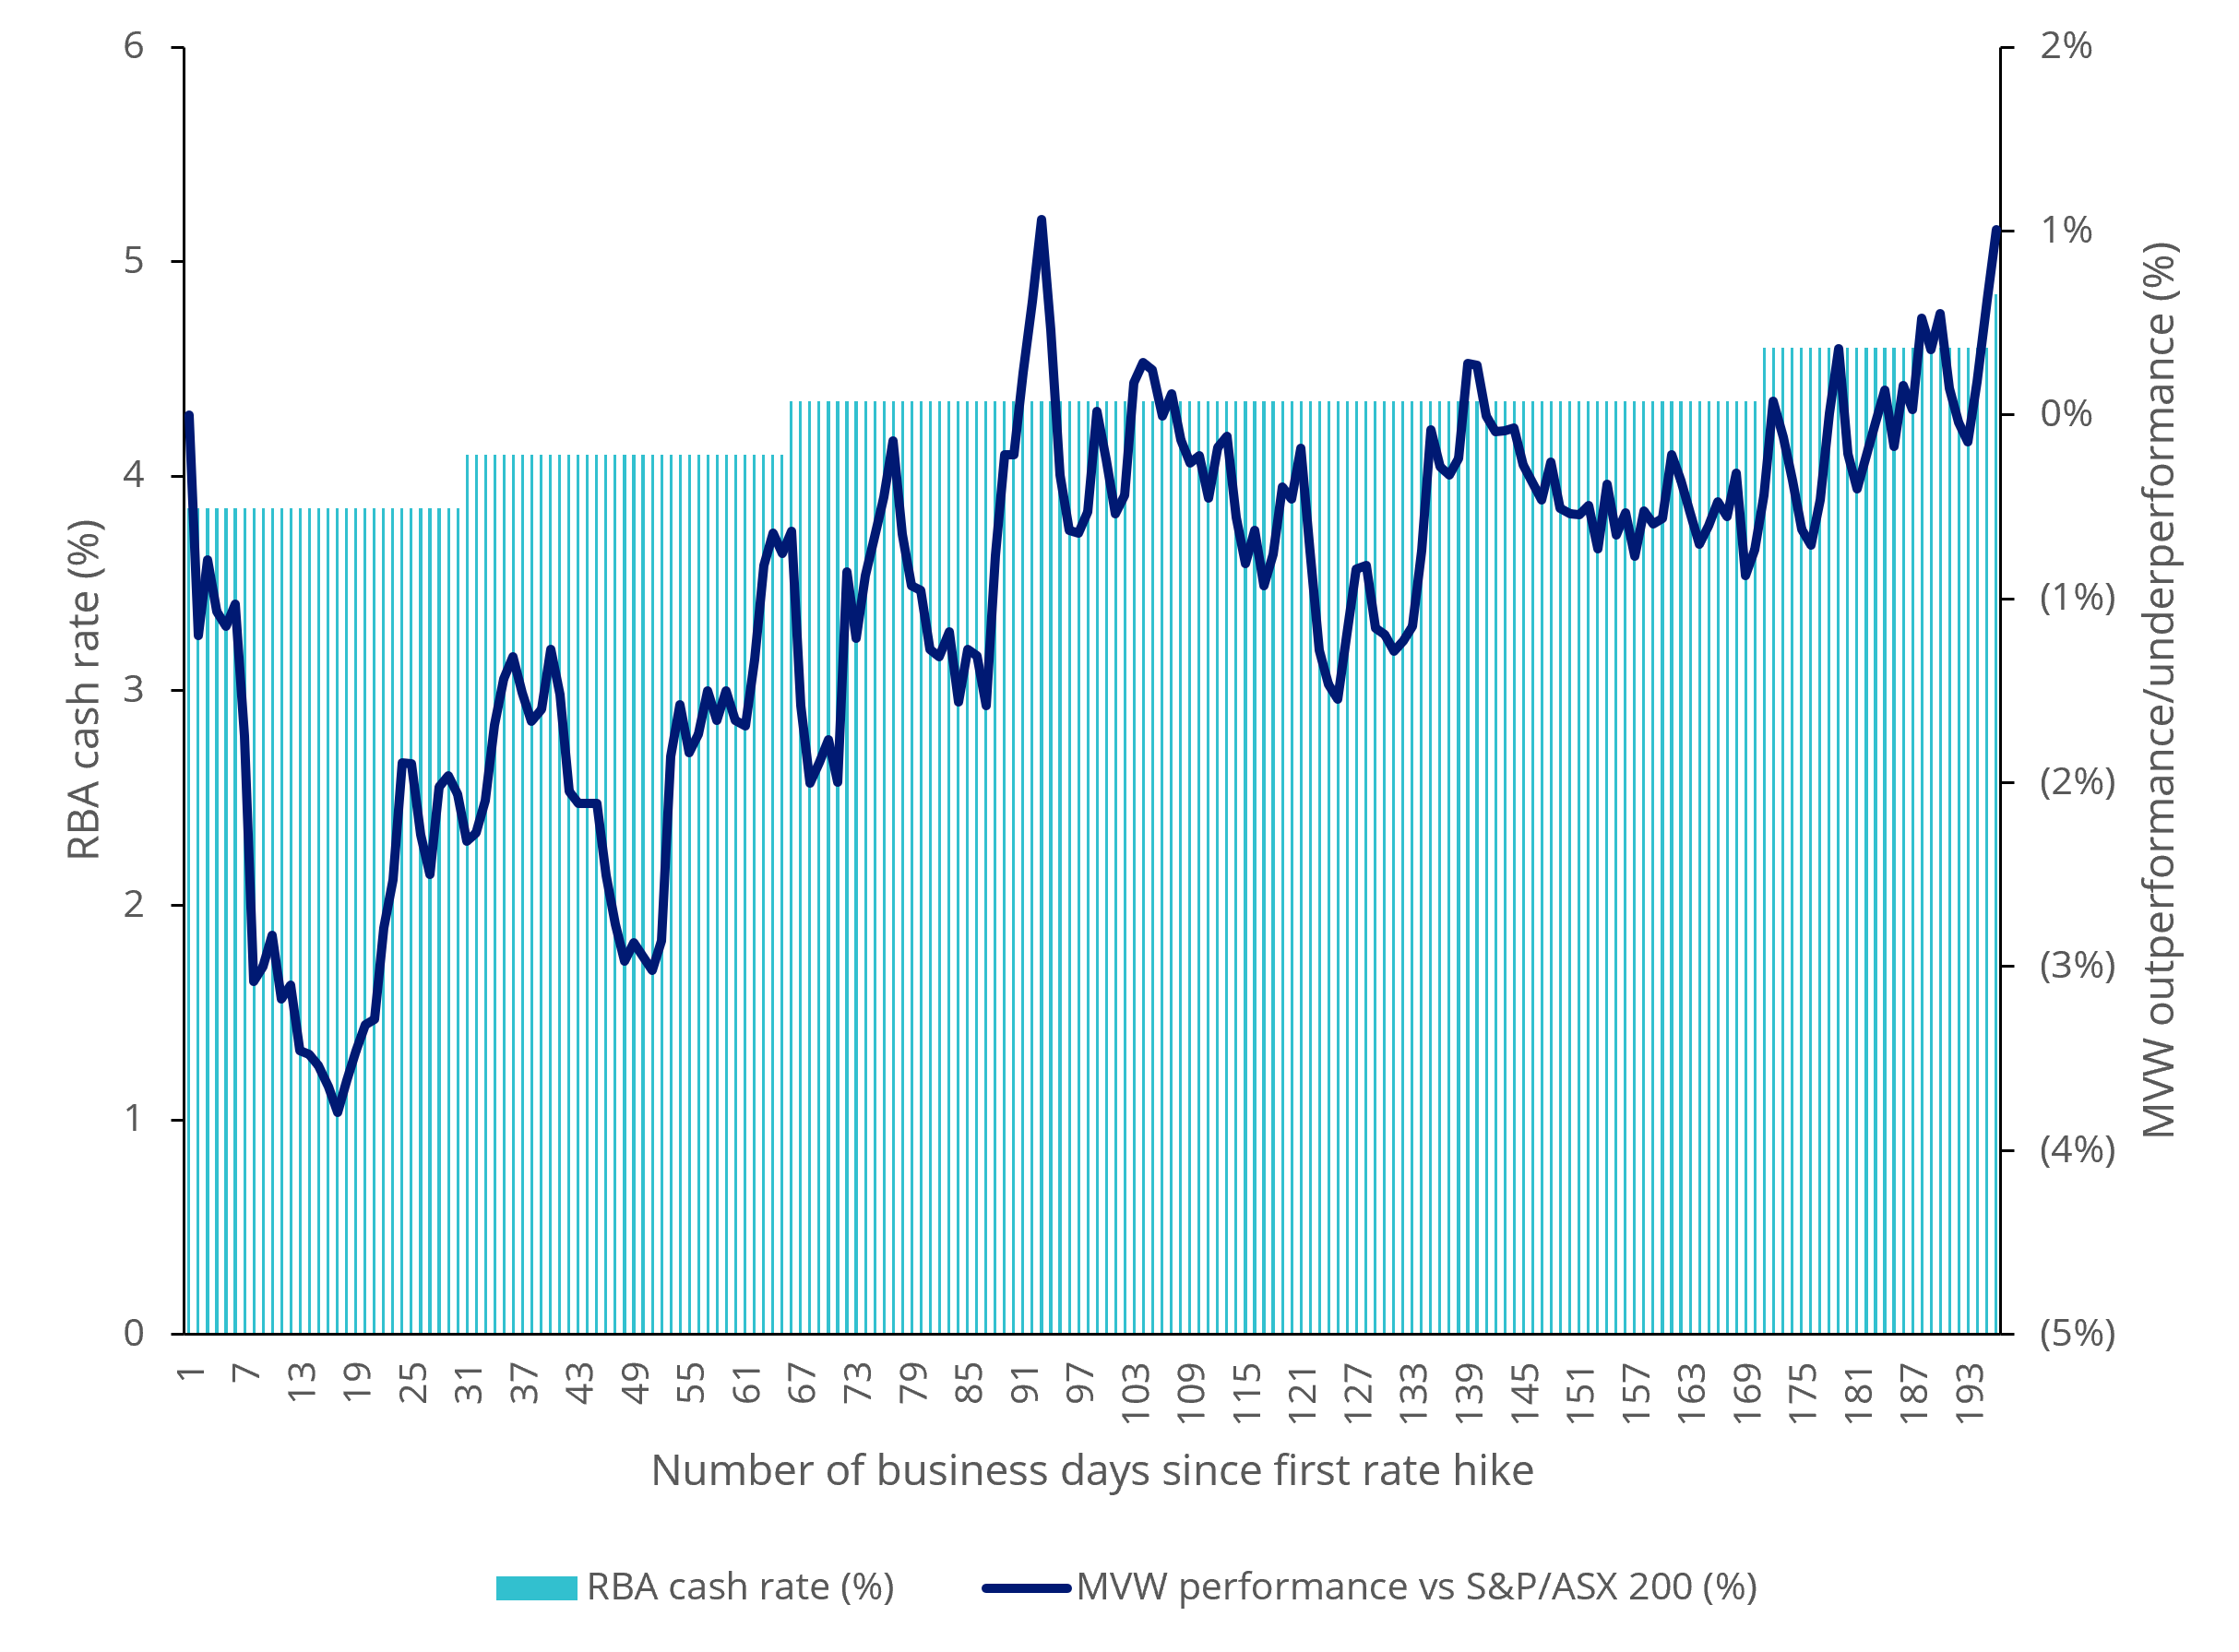
Table: Relative performance (%) to 31 October 2026
| 1 month | 3 months | 6 months | 1 year | 3 years (p.a.) | 5 years (p.a.) | 10 years (p.a.) | Since ETF inception (p.a.) | |
| MVW total return | 1.48 | 1.77 | 5.65 | 2.54 | 11.32 | 7.20 | 9.00 | 8.89 |
| S&P/ASX 200 Index | 1.38 | 0.45 | 4.60 | 3.69 | 13.35 | 8.00 | 9.43 | 8.23 |
* MVW Inception date is 4 March 2014. A copy of the factsheet is here.
Source: Morningstar Direct, VanEck. The chart and table above show past performance of MVW and of the S&P/ASX 200. You cannot invest directly in an index. Results assume immediate reinvestment of distributions. MVW results are net of management fees and other costs incurred in the fund, but before brokerage fees and bid/ask spreads incurred when investors buy/sell on the ASX. Returns for periods longer than one year are annualised. Past performance is not indicative of future performance. The S&P/ASX 200 Index is shown for comparison purposes as it is the widely recognised benchmark used to measure the performance of the broad Australian equities market. It includes the 200 largest ASX-listed companies, weighted by market capitalisation. MVW’s index measures the performance of the largest and most liquid ASX-listed companies, weighted equally at rebalance. MVW’s index has fewer companies and different industry allocations than the S&P/ASX 200. Click here for more details.
For investors who see an opportunity in stronger forecast earnings growth and less demanding valuations beyond the largest companies, equal weighting may be a logical approach to Australian equities.
Key risks
An investment in our Australian equal weight ETF carries risks associated with: financial markets generally, individual company management, industry sectors, fund operations and tracking an index. See the VanEck Australian Equal Weight ETF PDS and TMD for more details.
MVW is likely to be appropriate for a consumer who is seeking capital growth and a regular income distribution, is intending to use the product as a core, minor or satellite allocation within a portfolio, has an investment timeframe of at least 5 years, and has a high risk/return profile.

Published: 08 November 2026
Any views expressed are opinions of the author at the time of writing and is not a recommendation to act.
VanEck Investments Limited (ACN 146 596 116 AFSL 416755) (VanEck) is the issuer and responsible entity of all VanEck exchange traded funds (Funds) trading on the ASX. This information is general in nature and not personal advice, it does not take into account any person’s financial objectives, situation or needs. You should consider whether or not an investment in any Fund is appropriate for you. Investments in a Fund involve risks associated with financial markets. These risks vary depending on a Fund’s investment objective. Refer to the applicable product disclosure statement (PDS) and target market determination (TMD) available at vaneck.com.au for more details. Investment returns and capital are not guaranteed.