The case for changing the party mix


Everyone has their favourites in a bag of Allen’s Party Mix. But if it were mostly jelly snakes with a few other lollies down the bottom, you might question the word “mix”.
Investors in the Australian equity market could ask something similar – a broad market ETF can give you access to a range of companies. But when you open the pack, you may find that there are a few too many jelly snakes of the financials and materials flavours.
In our view, the mix needs changing. As Australia enters stagflation and looks to remain there for the foreseeable future, we argue investors have to consider which businesses receive the biggest allocations in their portfolio and whether a different approach could deliver a more appealing result.
The economy makes the mix matter
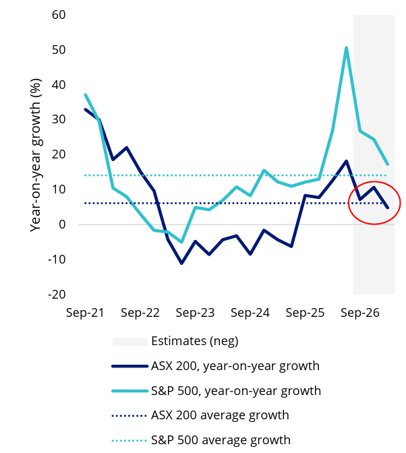
The thorn in policymakers’ side remains inflation. If wages, materials and financing costs rise faster than sales, earnings margins will likely narrow and dividend payouts may take a hit.
We think another 25 basis point RBA increase before the end of 2026 is possible because inflation pressures continue to persist across key categories such as electricity and housing. If it happens, that will make it five rate hikes from Australia’s central bank this calendar year.
Combined with sub-2% GDP growth, these pressures explain our stagflationary assessment and the difficult backdrop for company earnings.
Chart 1: Australian earnings per share growth on negative downtrend
Source: Bloomberg, as at 2 October 2026.
Long-end bond yields sitting at two-decade highs and higher-for-longer crude oil prices pose additional challenges.
What buying the index gives you
In this environment, finding promising companies is only part of the task. How you spread your money matters too. A landmark study1found that the mix of assets held by pension funds explained about 94% of their returns’ ups and downs over time. As the economy changes, it may be time to rethink the mix not just across asset classes but within asset classes as well.
The S&P/ASX 200 weights companies by float-adjusted market capitalisation. Larger businesses receive larger allocations. Investors tracking it will place more capital in those businesses, irrespective of their own assessment of the economic outlook.
But as September 2026 demonstrated, this is not always the best approach. BHP and Commonwealth Bank, the two largest companies on the Australian stock market, represented more than 20% of the index and accounted for 54% of its 2.42% monthly decline.
That concentration works in investors’ favour when the largest businesses lead and markets are rising, but could work the other way if they were both to lag. Materials and financials are cyclical sectors, so their performance is linked to the economy and tends to vary more than defensives such as healthcare and consumer staples, which maintain earnings through the cycle.
We think investors should be considering how much of their portfolio depends on the success of two cyclical companies and if they are not comfortable with it, or whether it would be prudent to give portfolio space to businesses with other earnings sources.
Compare the exposures
The VanEck Australian Equal Weight ETF (MVW) spreads its investment equally across the companies it holds. Those proportions change as share prices move between rebalances, so the fund resets them to equal shares every quarter.
The result of this approach is a different allocation across both companies and sectors. As the below table shows, financials and materials account for nearly 60% of the S&P/ASX 200. But in MVW, that figure is under 40%.
Table 1: MVW and S&P/ASX 200 sector weights
| Sector | MVW (%) | S&P/ASX 200 (%) |
|---|---|---|
| Financials | 19.3 | 32.76 |
| Materials | 20.3 | 26.51 |
| Industrials | 12.0 | 6.76 |
| Real estate | 10.8 | 5.35 |
| Health care | 8.2 | 6.97 |
| Information technology | 5.7 | 2.11 |
| Consumer discretionary | 5.5 | 6.53 |
| Energy | 5.2 | 4.66 |
| Communication services | 5.2 | 3.14 |
| Consumer staples | 4.0 | 3.73 |
| Utilities | 3.8 | 1.47 |
Sources: FactSet, VanEck, S&P as at 12 October 2026. Dates differ. Weights are subject to change and rounding.
As a result, industrials, health care and information technology businesses are given a larger share in MVW. There is greater representation for consumer staples and utilities businesses – two sectors that have historically outperformed when the economy is in a slowdown.
Look across and within sectors
Insurance illustrates why investors should look beneath sector labels. Banks and insurers both sit within financials, but their earnings depend on different factors.
We all have insurance, be it for our car or our health. Some of it is mandated to have irrespective of if we want it, like compulsory third party (CTP) insurance for motor vehicles, so demand tends to inelastic. Banks, on the other hand, tend to perform better when more homes are selling and business clients are growing.
The numbers are starting to reflect this reality.
QBE Insurance Group (ASX: QBE) provides a good example. In its first-half 2026 results, premiums grew while its combined operating ratio remained around 93%. The ratio measures claims and expenses against premium revenue, with a result below 100% indicating an underwriting profit. Its adjusted return on equity was 17.7%, above its medium-term outlook of more than 15%.
QBE also writes 78% of its premiums offshore. Its earnings therefore draw on a wider set of economies than Australia alone. That international footprint is relevant when domestic conditions look less supportive, although claims inflation, catastrophes and competition remain risks.
CBA, on the other hand, is overwhelmingly an Australian business. Its earnings depend on Australian household and business borrowing. While its FY26 result to 30 June 2026 was solid, its forward guidance wasn’t strong. Its earnings are tied to the local credit cycle, interest rates and the housing market, and increased competition in putting pressure on margins
A look at QBE’s weighting within MVW shows that it receives a similar share of the portfolio to Commonwealth Bank. But the two stocks’ weightings in the S&P/ASX 200 are very different.
Table 2: Financials stocks in MVW vs S&P/ASX 200
| MVW | S&P/ASX 200 Index | |
|---|---|---|
| Commonwealth Bank of Australia | 1.31 | 9.50 |
| National Australia Bank Limited | 1.35 | 4.52 |
| Westpac Banking Corporation | 1.36 | 4.45 |
| ANZ Group Holdings Limited | 1.39 | 4.30 |
| Macquarie Group, Ltd. | 1.37 | 3.25 |
| QBE Insurance Group Limited | 1.54 | 1.41 |
| Suncorp Group Limited | 1.38 | 0.76 |
| Insurance Australia Group Ltd | 1.44 | 0.72 |
| Washington H. Soul Pattinson and Company Limited | 1.38 | 0.60 |
| Medibank Private Ltd. | 1.37 | 0.48 |
| ASX Limited | 1.49 | 0.45 |
| Steadfast Group Limited | 1.36 | 0.24 |
| Bendigo & Adelaide Bank Ltd. | 1.37 | 0.23 |
| Bank of Queensland Limited | 1.34 | 0.16 |
Source: FactSet, as at 12 October 2026. Weights are subject to change without notice. Securities mentioned are not a recommendation to act.
A track record worth considering
The differences in exposure have delivered meaningful differences in returns over the long term. Recently the dynamics noted above, have come to the fore and over the past six months to 15 October 2026, MVW has returned +1.61%, compared with the 1.18% fall for the S&P/ASX 200%. But the real advantage of MVW is its long-term performance. Since its inception in March 2014, MVW has outperformed the benchmark by 0.66% per annum. Over more than 12 years of compounding, that is a meaningful advantage. Noting that past performance is not indicative of future performance.
Chart 2: Cumulative performance since MVW inception date to 15 October 2026
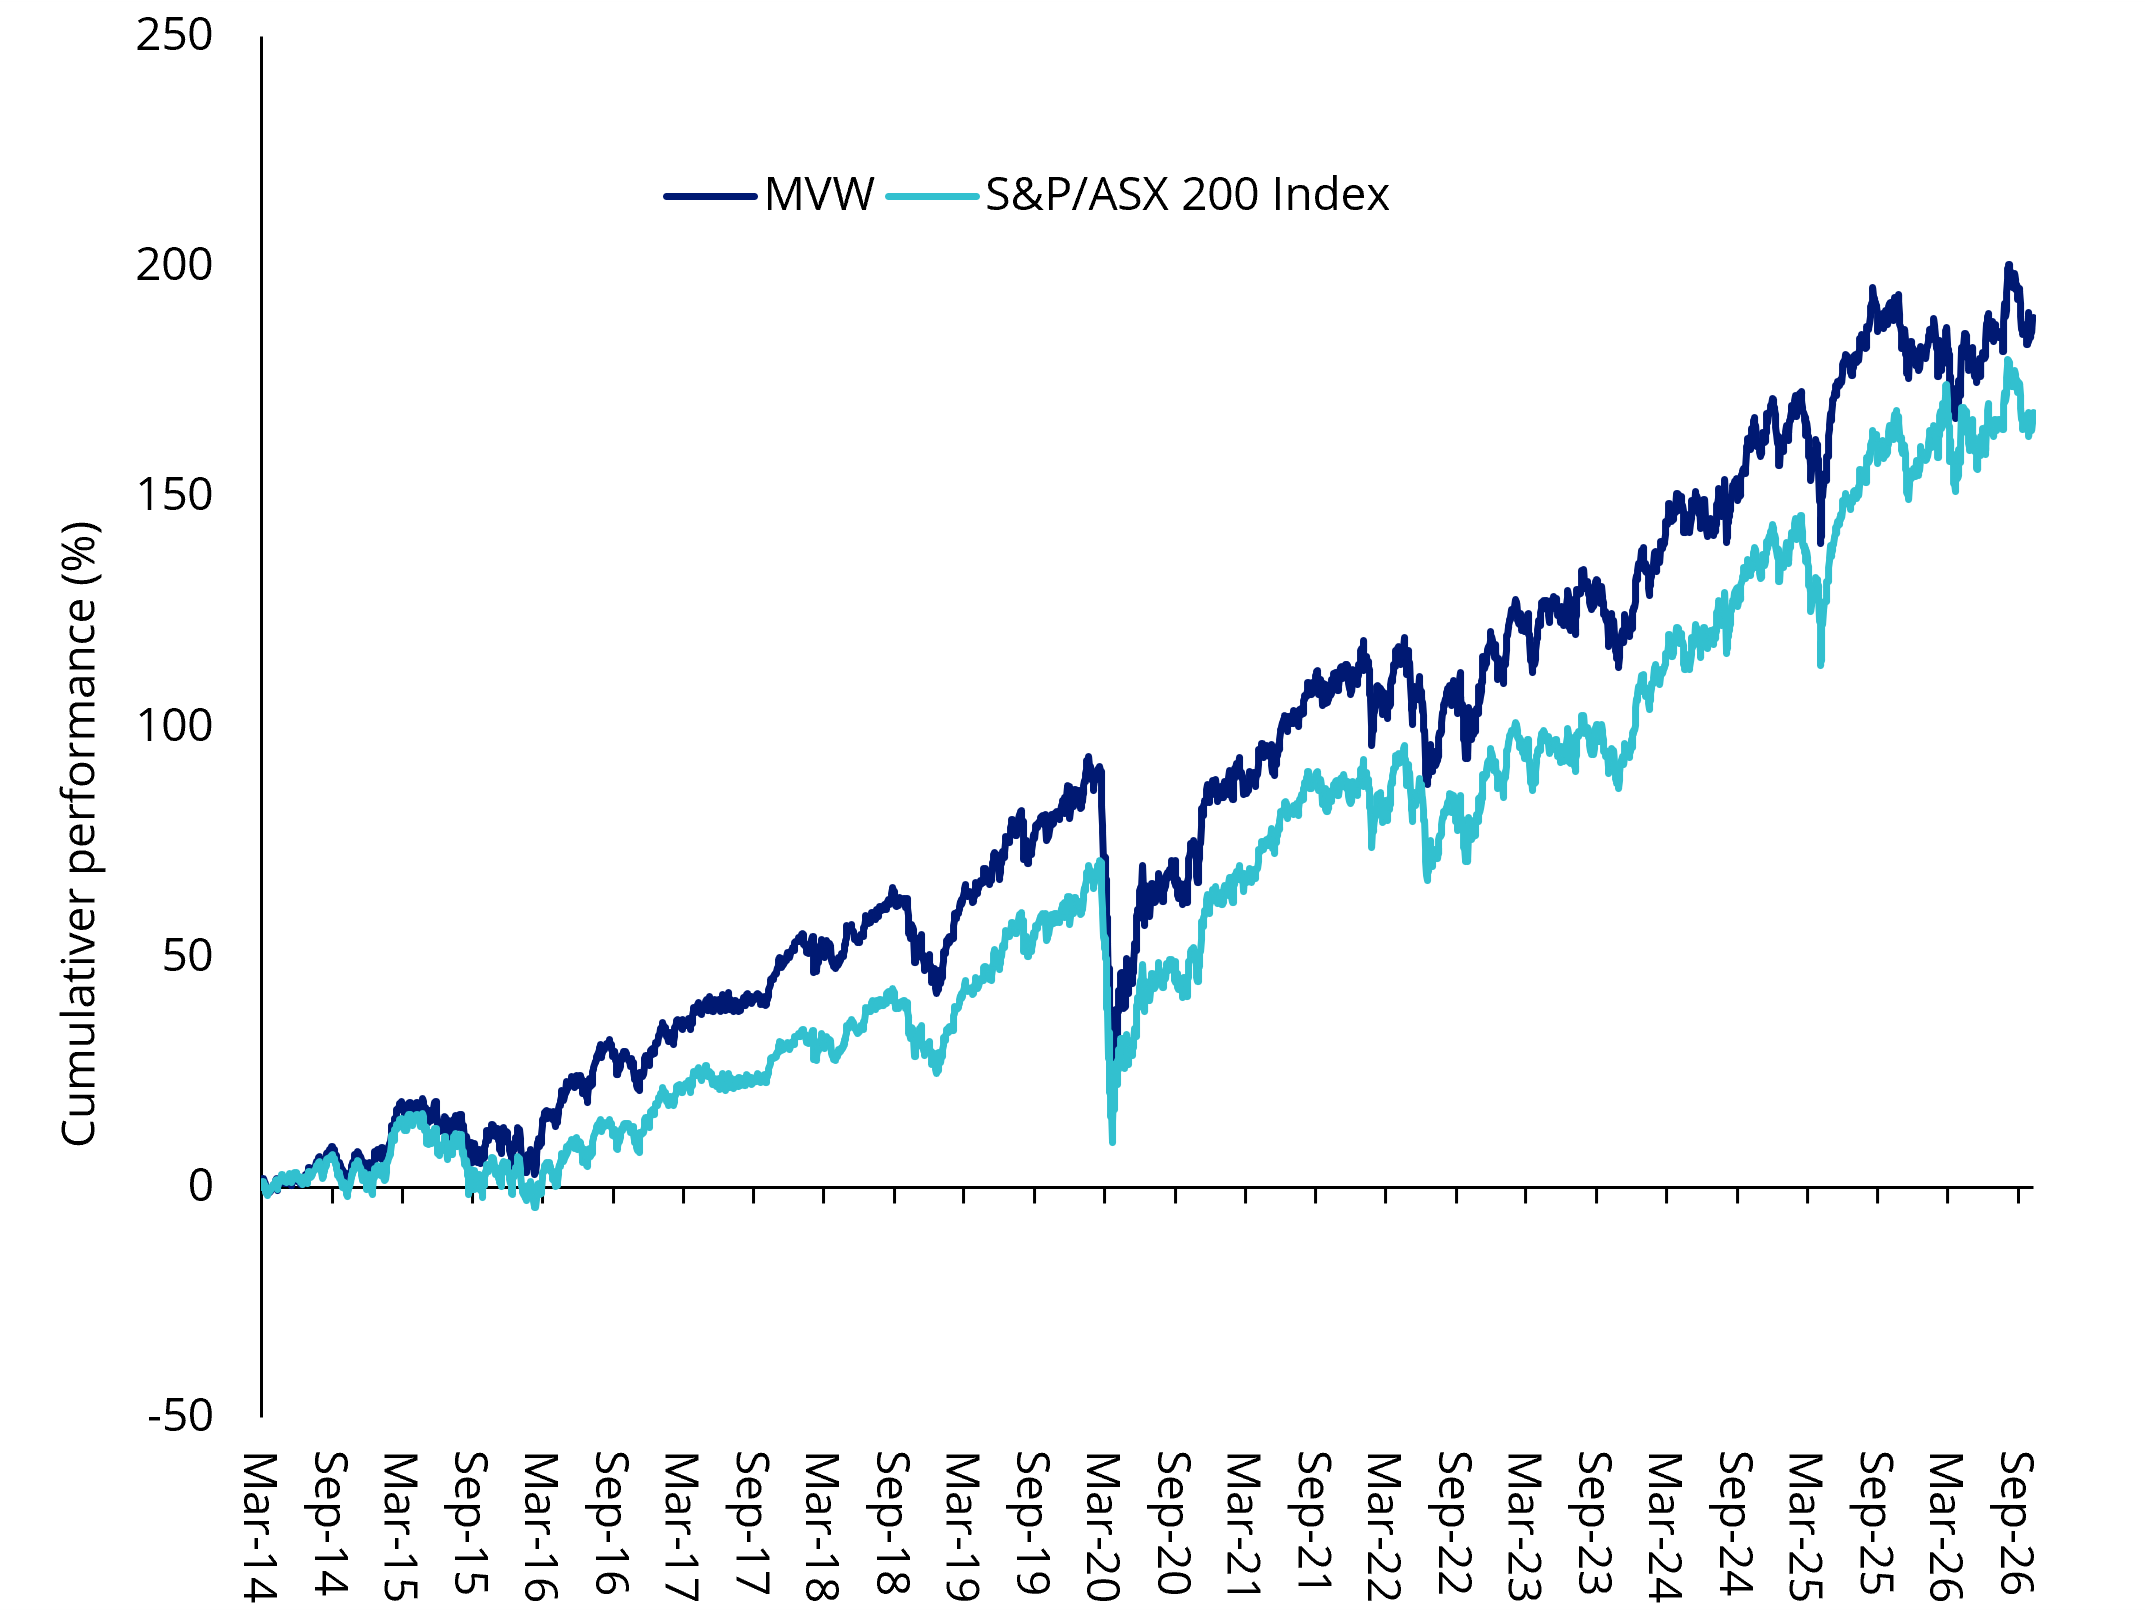
Table 3: Trailing performance to 15 October 2026
| 1 Month (%) | 3 Months (%) | 6 Months (%) | 1 yr (%) |
3 yrs (% p.a.) |
5 yrs (% p.a.) |
10 yrs (% p.a.) |
Since Inception* (% p.a.) |
|
|---|---|---|---|---|---|---|---|---|
| MVW | 0.78 | 0.72 | 1.61 | -1.25 | 8.88 | 6.46 | 8.46 | 8.73 |
| S&P/ASX 200 | 0.60 | -0.17 | -1.18 | 0.27 | 11.09 | 7.43 | 8.96 | 8.07 |
| Difference | +0.18 | +0.89 | +2.79 | -1.52 | -2.21 | -0.97 | -0.50 | +0.66 |
* MVW Inception date is 4 March 2014 a copy of the factsheet is here.
Chart 2 and Table 3 source: Morningstar Direct, VanEck. The chart and table above show past performance of MVW and of the S&P/ASX 200. You cannot invest directly in an index. Results are calculated to the last business day of the month and assume immediate reinvestment of distributions. MVW results are net of management fees and other costs incurred in the fund, but before brokerage fees and bid/ask spreads incurred when investors buy/sell on the ASX. Returns for periods longer than one year are annualised. Past performance is not indicative of future performance.
MVW, we think, demonstrates that investors have a credible alternative to accepting the index’s allocation as their own.
A choice about the economy ahead
There is nothing wrong with having favourites in the bag. But when the economic backdrop changes, investors should consider whether their portfolio still has the proportions they want. Equal weighting keeps Australia’s largest companies in the mix while giving other businesses a greater chance to shape the result.
MVW offers a way to retain Australia’s largest companies while giving other large, liquid businesses a greater role. It remains an equity investment, with the risk of losses, but reduces dependence on a handful of companies delivering the desired result.
Key risks
An investment in our Australian equal weight ETF carries risks associated with: financial markets generally, individual company management, industry sectors, fund operations and tracking an index. See the VanEck Australian Equal Weight ETF PDS and TMD for more details.
MVW is likely to be appropriate for a consumer who is seeking capital growth and a regular income distribution, is intending to use the product as a core, minor or satellite allocation within a portfolio, has an investment timeframe of at least 5 years, and has a high risk/return profile.
1 - “Determinants of Portfolio Performance" by Gary P. Brinson, L. Randolph Hood, and Gilbert L. Beebower, 1986


Published: 16 October 2026
The S&P/ASX 200 Index is shown for comparison purposes as it is the widely recognised benchmark used to measure the performance of the broad Australian equities market. It includes the 200 largest ASX-listed companies, weighted by market capitalisation. MVW’s index measures the performance of the largest and most liquid ASX-listed companies, weighted equally at rebalance. MVW’s index has fewer companies and different industry allocations than the S&P/ASX 200. Click here for more details.
Any views expressed are opinions of the author at the time of writing and is not a recommendation to act.
VanEck Investments Limited (ACN 146 596 116 AFSL 416755) (VanEck) is the issuer and responsible entity of all VanEck exchange traded funds (Funds) trading on the ASX. This information is general in nature and not personal advice, it does not take into account any person’s financial objectives, situation or needs. The product disclosure statement (PDS) and the target market determination (TMD) for all Funds are available at vaneck.com.au. You should consider whether or not an investment in any Fund is appropriate for you. Investments in a Fund involve risks associated with financial markets. These risks vary depending on a Fund’s investment objective. Refer to the applicable PDS and TMD for more details on risks. Investment returns and capital are not guaranteed.